Detailed results of HR5546A_XRay_em_bcr3 by PSVS
Output from PDBStat
Output from PROCHECK
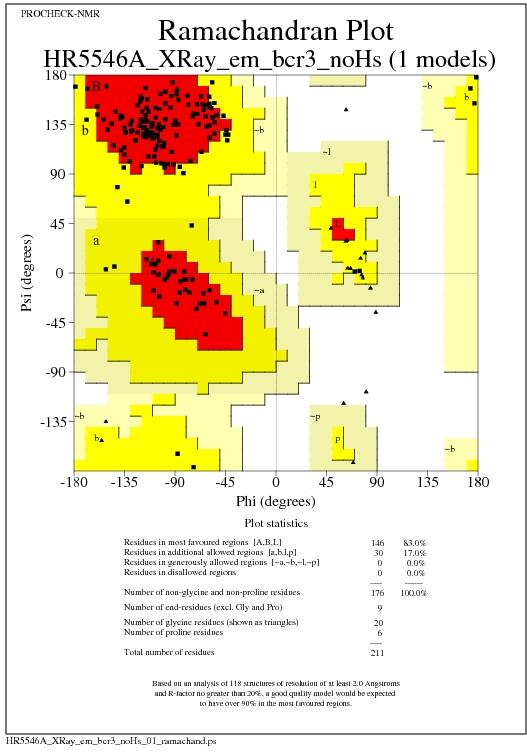
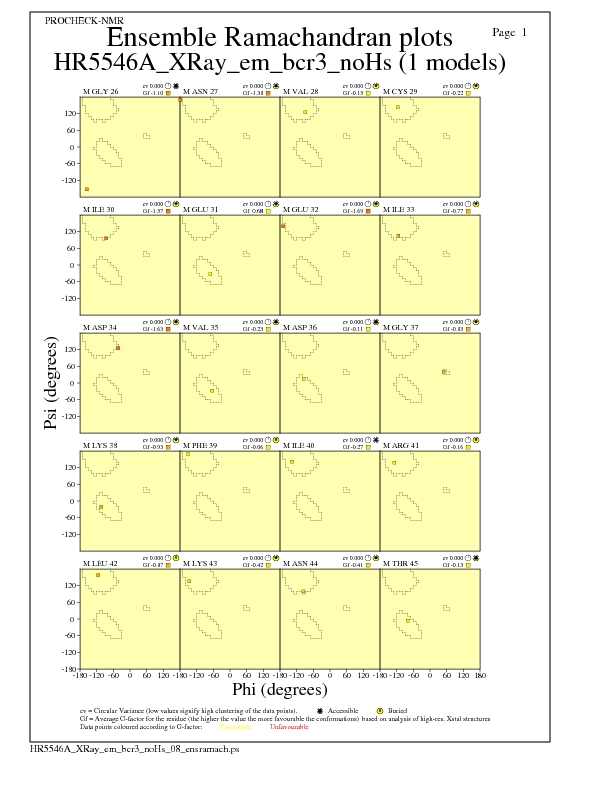
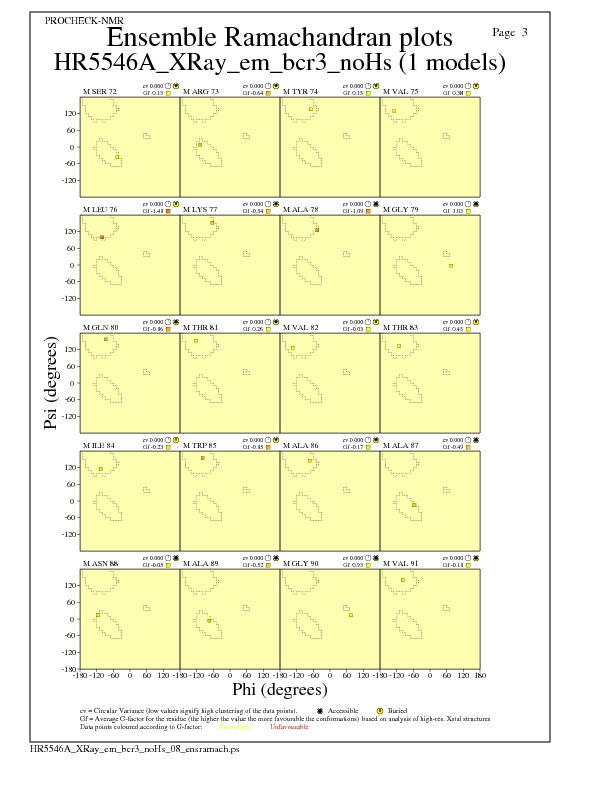
Ramachandran Plot for all models
Text summary of Ramachandran Plot
+----------<<< P R O C H E C K S U M M A R Y >>>----------+
| |
| HR5546A_XRay_em_bcr3_noHs_000.rin 0.0 211 residues |
| |
+| Ramachandran plot: 83.0% core 17.0% allow 0.0% gener 0.0% disall |
| |
*| All Ramachandrans: 7 labelled residues (out of 197) |
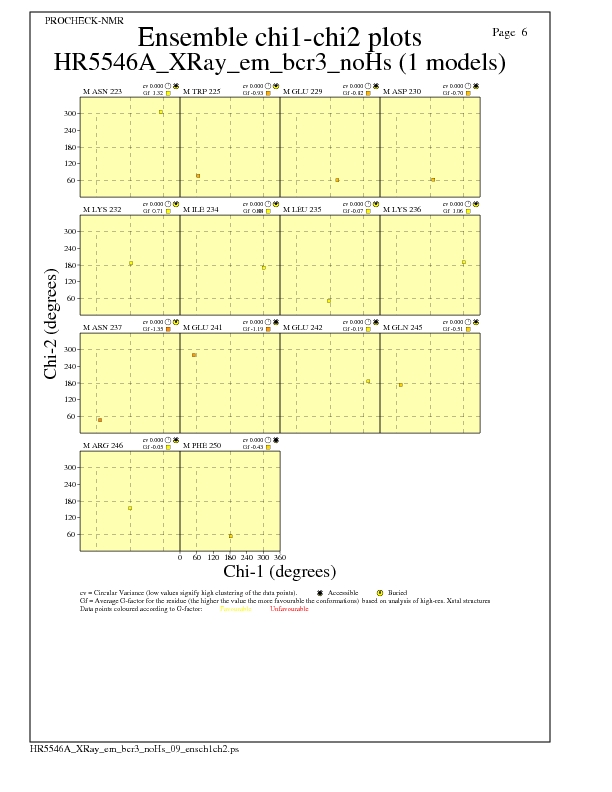
+| Chi1-chi2 plots: 3 labelled residues (out of 114) |
JPEG image for all model Ramachandran Plot
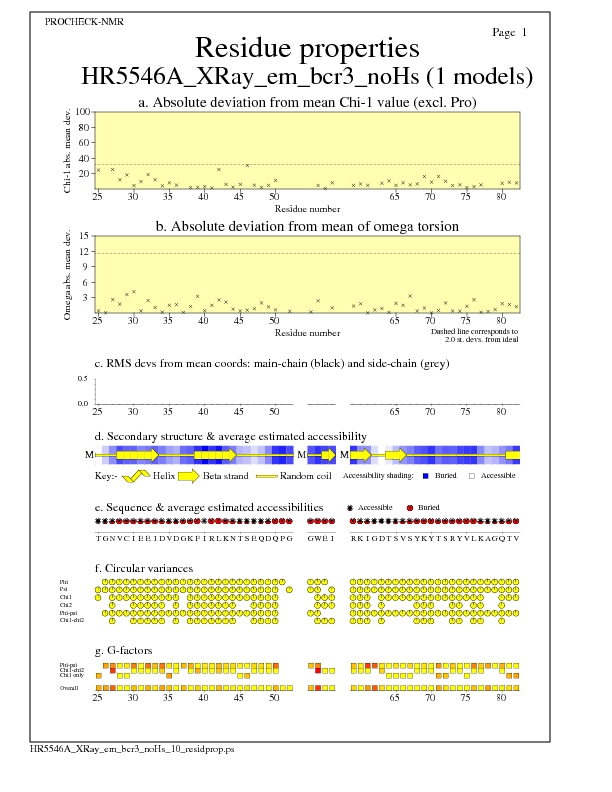
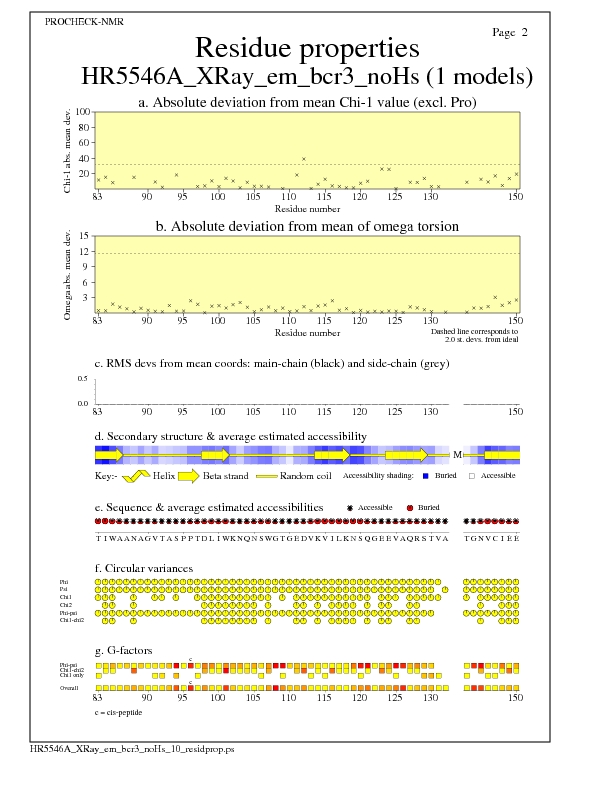
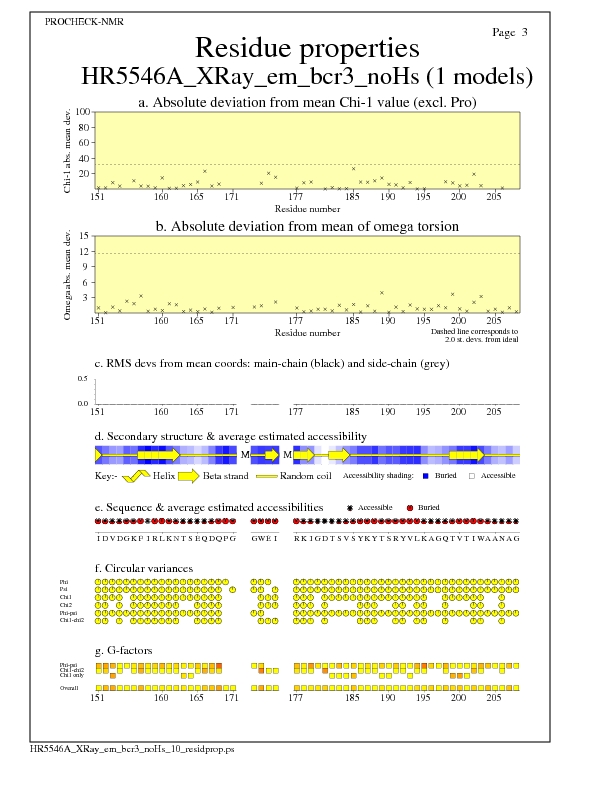
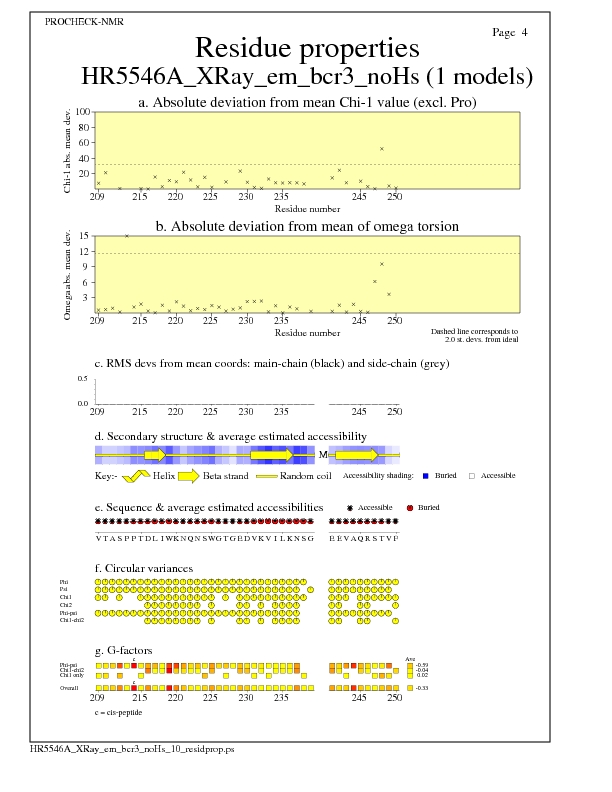
Residue Properties for all models
JPEG for all model Residue Properties - page $num_n
JPEG for all model Residue Properties - page $num_n
JPEG for all model Residue Properties - page $num_n
JPEG for all model Residue Properties - page $num_n
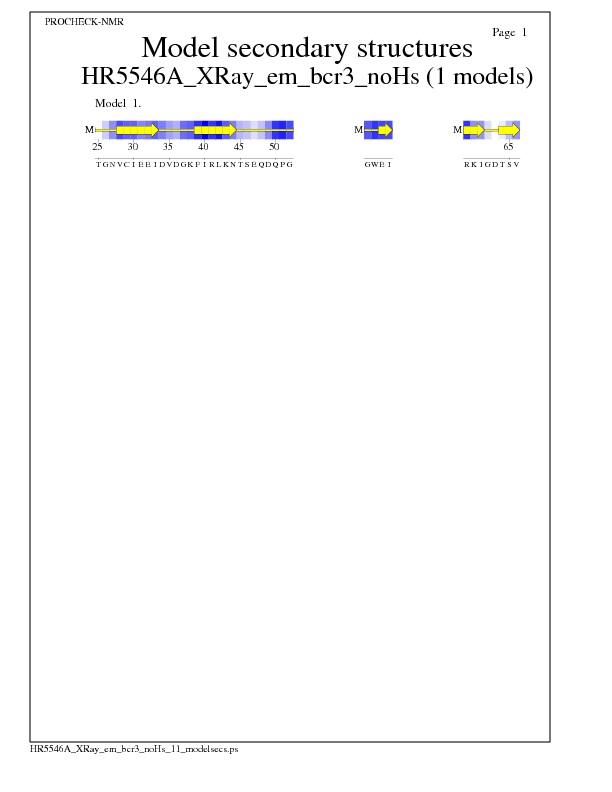
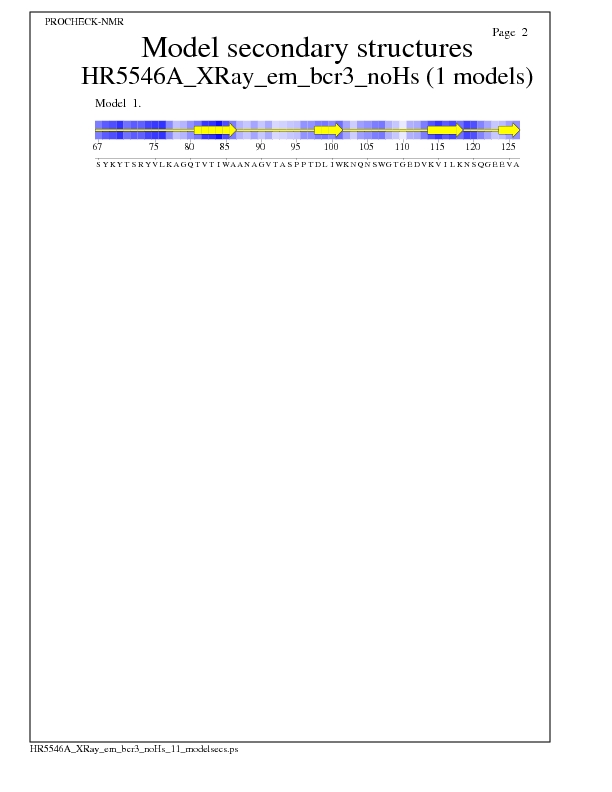
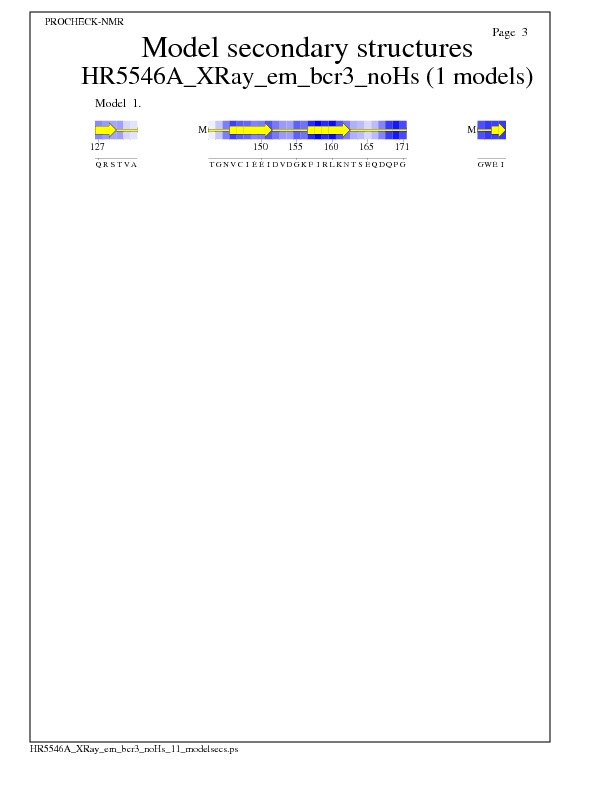
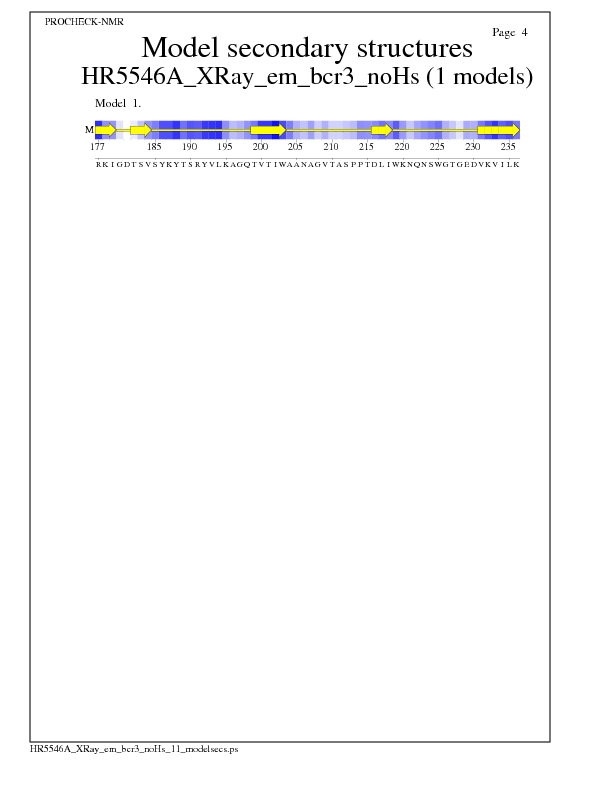
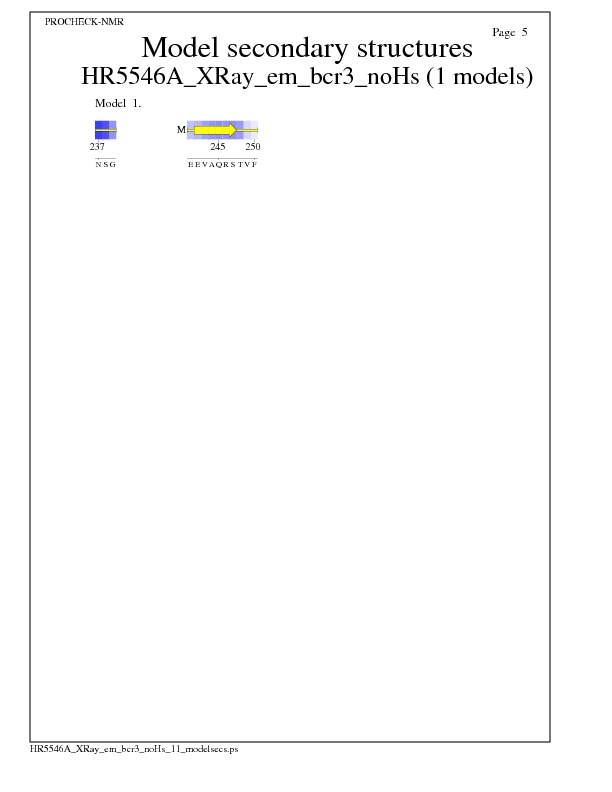
Model Secondary Structures from Procheck
JPEG for Model Secondary Structures - page $num_n
JPEG for Model Secondary Structures - page $num_n
JPEG for Model Secondary Structures - page $num_n
JPEG for Model Secondary Structures - page $num_n
JPEG for Model Secondary Structures - page $num_n
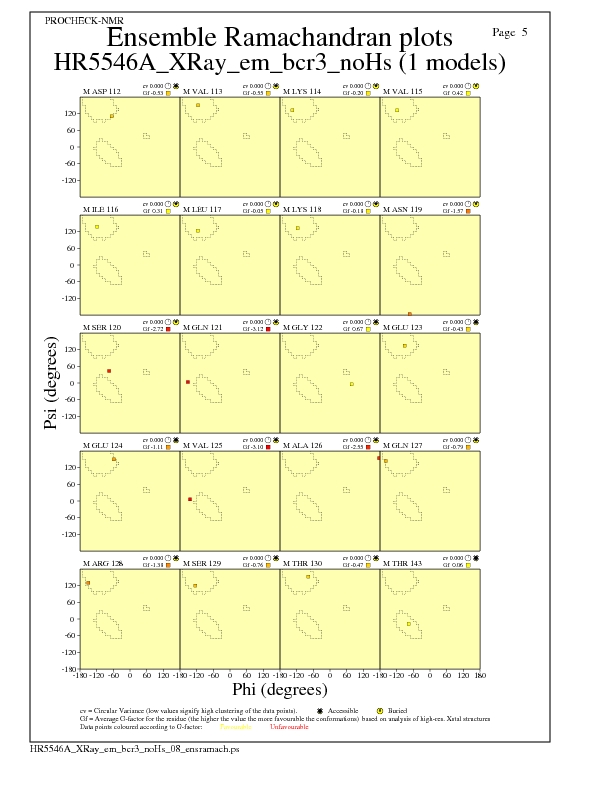
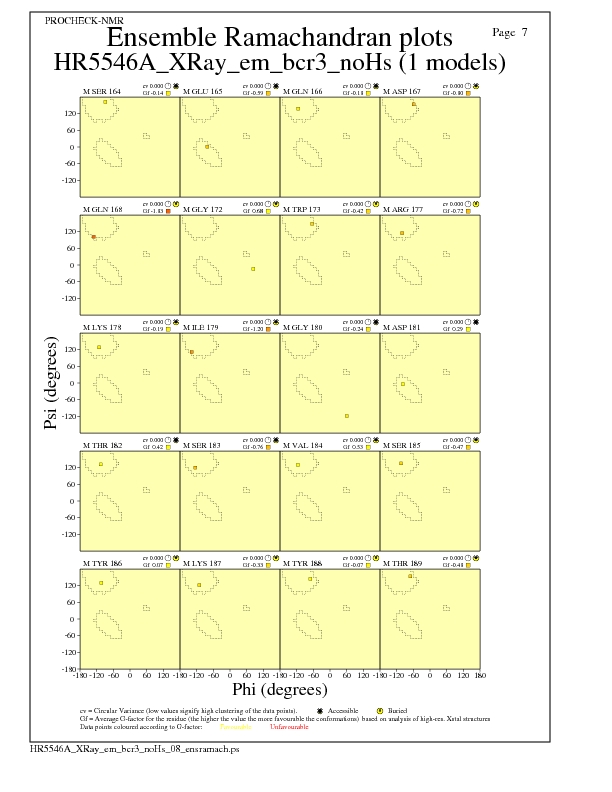
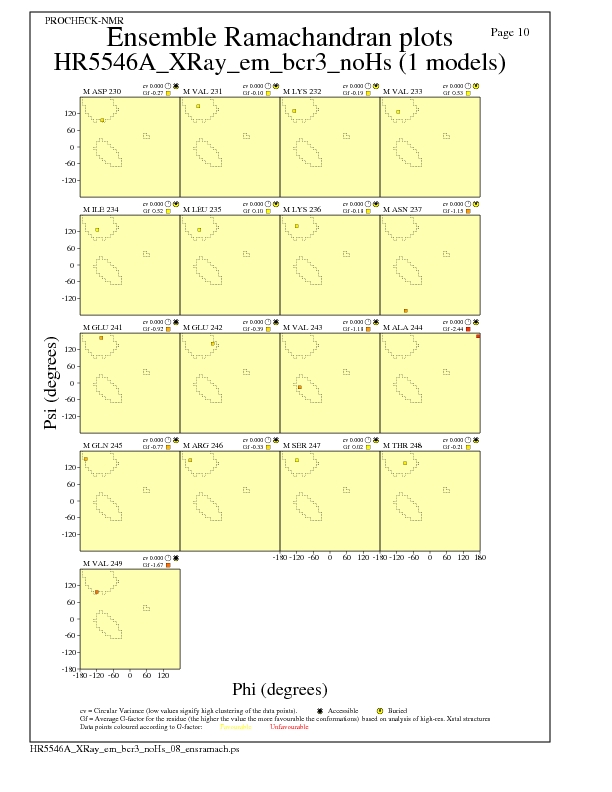
Ramachandran Plots for each residue
JPEG for residue Ramachandran Plots - page $num_n
JPEG for residue Ramachandran Plots - page $num_n

JPEG for residue Ramachandran Plots - page $num_n
JPEG for residue Ramachandran Plots - page $num_n

JPEG for residue Ramachandran Plots - page $num_n
JPEG for residue Ramachandran Plots - page $num_n

JPEG for residue Ramachandran Plots - page $num_n
JPEG for residue Ramachandran Plots - page $num_n

JPEG for residue Ramachandran Plots - page $num_n

JPEG for residue Ramachandran Plots - page $num_n
Ramachandran analysis for each residue from Molprobity
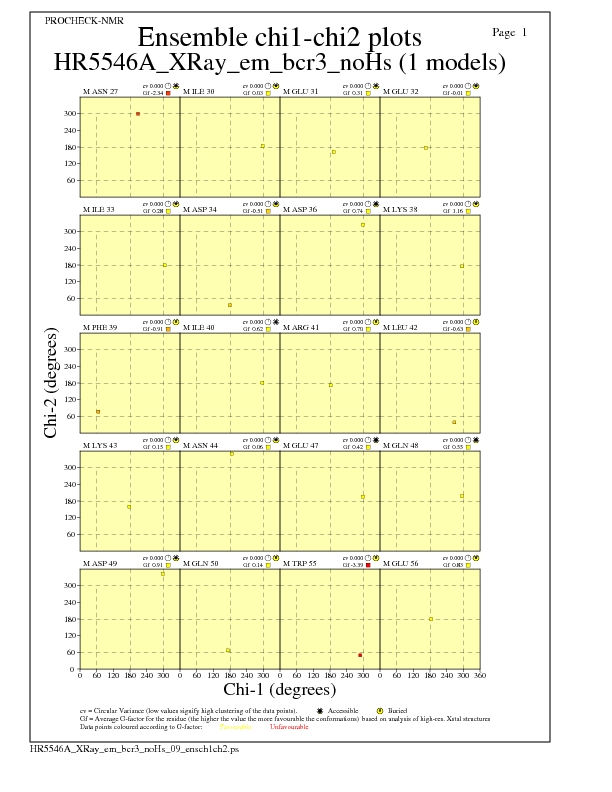
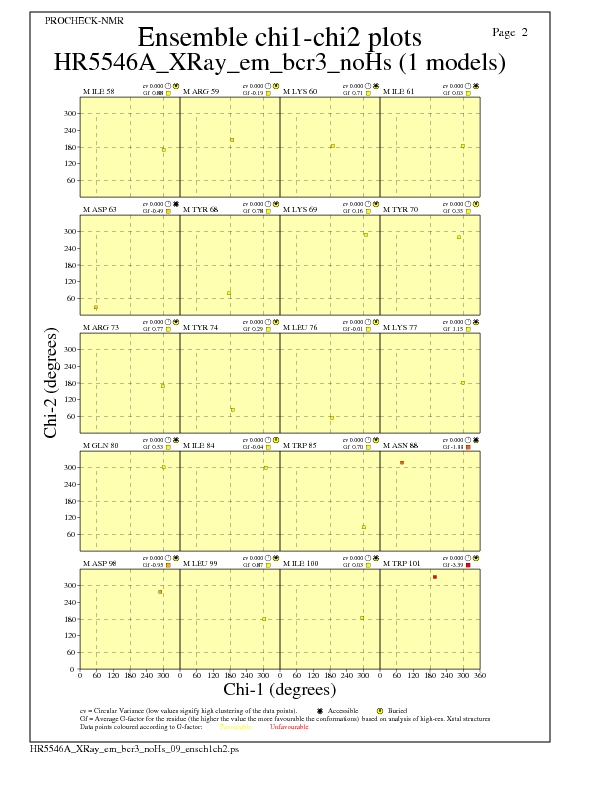
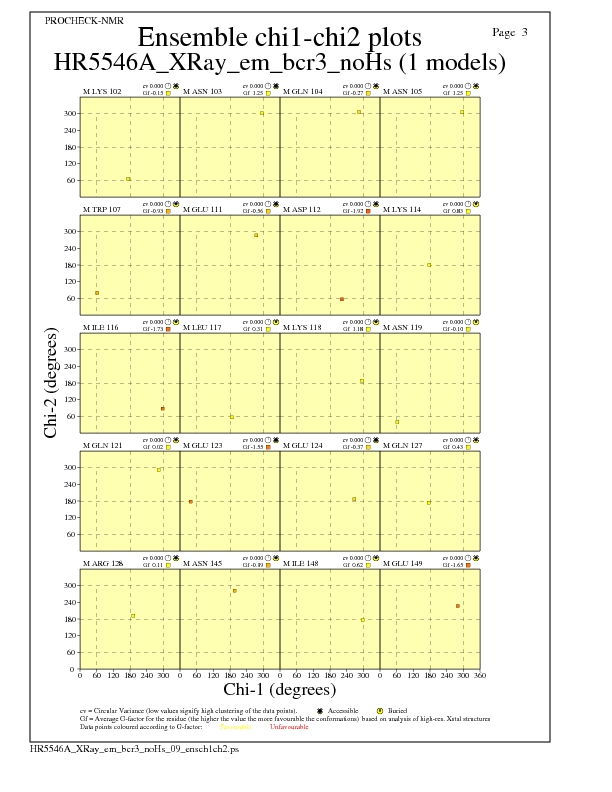
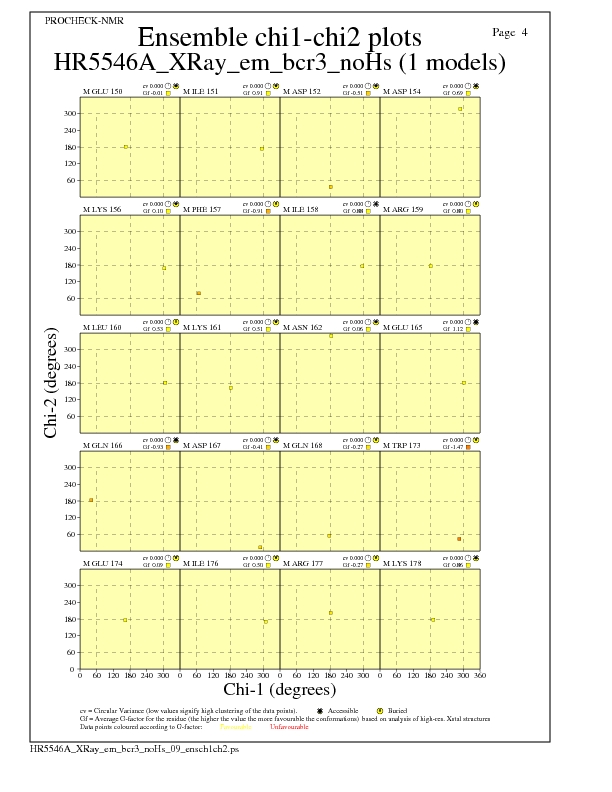
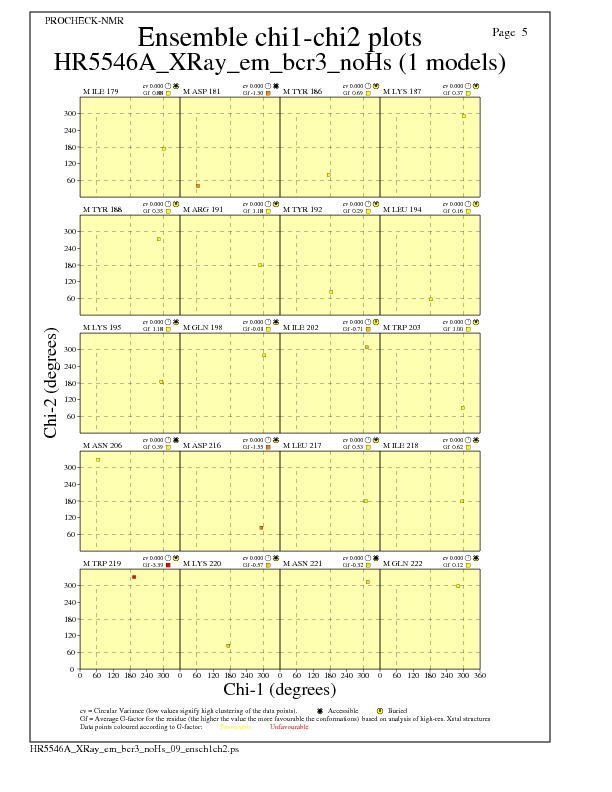
Chi1-Chi2 Plots for each residue
JPEG for residue Chi1-Chi2 Plots - page $num_n
JPEG for residue Chi1-Chi2 Plots - page $num_n
JPEG for residue Chi1-Chi2 Plots - page $num_n
JPEG for residue Chi1-Chi2 Plots - page $num_n
JPEG for residue Chi1-Chi2 Plots - page $num_n
JPEG for residue Chi1-Chi2 Plots - page $num_n
Procheck G-factors for phi-psi for each residue
JPEG image for residue phi-psi G-factors
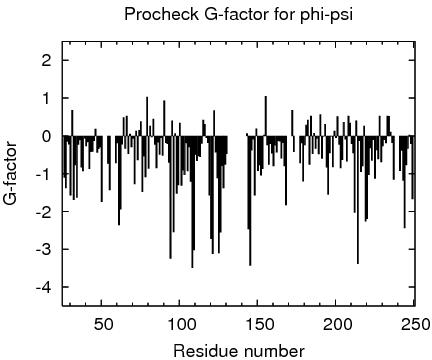
Table of Procheck G-factors for phi-psi for ordered residues
#phipsi_gfactor
#Residue\Model	average
26	-1.10
27	-1.38
28	-0.15
29	-0.22
30	-1.57
31	0.68
32	-1.69
33	-0.77
34	-1.63
35	-0.23
36	-0.11
37	-0.83
38	-0.93
39	-0.06
40	-0.27
41	-0.16
42	-0.87
43	-0.42
44	-0.41
45	-0.13
46	0.18
47	-0.44
48	-0.34
49	-0.30
50	-1.74
54	-0.73
55	-1.43
59	-0.72
60	-0.19
61	-2.36
62	-1.94
63	-0.22
64	0.49
65	-0.33
66	0.53
67	-0.47
68	0.05
69	-0.29
70	-0.07
71	-1.27
72	0.13
73	-0.64
74	0.15
75	0.38
76	-1.48
77	-0.54
78	-1.09
79	1.03
80	-0.86
81	0.26
82	-0.03
83	0.45
84	-0.23
85	-0.85
86	-0.17
87	-0.49
88	-0.05
89	-0.52
90	0.93
91	-0.18
92	-0.21
93	-0.70
94	-3.24
95	0.40
96	-2.54
97	0.06
98	-1.52
99	-1.30
100	0.34
101	-1.31
102	-0.91
103	-1.03
104	-0.19
105	-0.93
106	-0.29
107	-1.21
108	-3.49
109	-3.02
110	-0.49
111	-0.66
112	-0.53
113	-0.55
114	-0.20
115	0.42
116	0.31
117	-0.05
118	-0.18
119	-1.57
120	-2.72
121	-3.12
122	0.67
123	-0.43
124	-1.11
125	-3.10
126	-2.55
127	-0.79
128	-1.38
129	-0.76
130	-0.47
143	0.06
144	-2.46
145	-3.43
146	-0.38
147	-0.09
148	-1.57
149	0.19
150	-0.92
151	-0.77
152	-1.04
153	-0.87
154	0.02
155	1.05
156	-0.24
157	-0.76
158	-0.21
159	-0.46
160	-0.80
161	-0.25
162	-0.43
163	-0.13
164	-0.14
165	-0.59
166	-0.18
167	-0.80
168	-1.83
172	0.68
173	-0.42
177	-0.72
178	-0.19
179	-1.20
180	-0.24
181	0.29
182	0.42
183	-0.76
184	0.53
185	-0.47
186	0.07
187	-0.33
188	-0.07
189	-0.48
190	0.57
191	-0.60
192	-0.01
193	0.31
194	-0.83
195	-1.55
196	-0.45
197	-0.01
198	-0.82
199	0.13
200	-0.05
201	0.51
202	-0.23
203	-0.85
204	-0.63
205	0.36
206	-0.09
207	-0.67
208	0.53
209	0.34
210	-0.21
211	-0.45
212	-2.03
213	0.40
214	-3.38
215	-0.13
216	-0.95
217	-0.80
218	0.26
219	-2.26
220	-2.19
221	-1.03
222	-0.32
223	-0.65
224	-0.10
225	-1.13
226	-0.37
227	-0.61
228	0.53
229	-0.69
230	-0.27
231	-0.10
232	-0.19
233	0.53
234	0.52
235	0.10
236	-0.18
237	-1.15
241	-0.92
242	-0.39
243	-1.18
244	-2.44
245	-0.77
246	-0.33
247	0.02
248	-0.21
249	-1.67
#Reported_Model_Average	-0.592
#Overall_Average_Reported	-0.592
Procheck G-factors for all dihedral angles for each residue
JPEG image for residue all dihedral G-factors
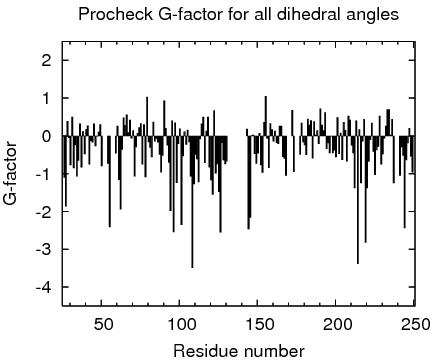
Table of Procheck G-factors for all dihedrals for ordered residues
#alldih_gfactor
#Residue\Model	average
25	-0.88
26	-1.10
27	-1.86
28	0.39
29	-0.05
30	-0.77
31	0.50
32	-0.85
33	-0.24
34	-1.07
35	-0.65
36	0.32
37	-0.83
38	0.12
39	-0.48
40	0.17
41	0.27
42	-0.75
43	-0.13
44	-0.17
45	0.32
46	-0.27
47	-0.01
48	0.10
49	0.30
50	-0.80
51	0.00
53	0.00
54	-0.73
55	-2.41
56	0.83
58	0.88
59	-0.46
60	0.26
61	-1.16
62	-1.94
63	-0.36
64	0.48
65	0.28
66	0.56
67	0.09
68	0.42
69	-0.06
70	0.14
71	-1.07
72	-0.29
73	0.07
74	0.22
75	0.33
76	-0.75
77	0.30
78	-1.09
79	1.03
80	-0.16
81	-0.31
82	-0.56
83	0.37
84	-0.14
85	-0.07
86	-0.17
87	-0.49
88	-0.96
89	-0.52
90	0.93
91	0.20
92	-0.25
93	-0.70
94	-1.98
95	0.40
96	-2.54
97	0.35
98	-1.24
99	-0.21
100	0.19
101	-2.35
102	-0.53
103	0.11
104	-0.23
105	0.16
106	-0.16
107	-1.07
108	-3.49
109	-1.27
110	-0.49
111	-0.61
112	-1.22
113	-0.08
114	0.32
115	0.50
116	-0.71
117	0.13
118	0.50
119	-0.83
120	-1.17
121	-1.55
122	0.67
123	-0.99
124	-0.74
125	-1.48
126	-2.55
127	-0.18
128	-0.64
129	-0.74
130	-0.67
131	0.40
142	0.00
143	0.18
144	-2.46
145	-2.16
146	0.01
147	0.02
148	-0.47
149	-0.73
150	-0.46
151	0.07
152	-0.77
153	-0.97
154	0.36
155	1.05
156	-0.07
157	-0.84
158	0.33
159	0.17
160	-0.14
161	0.13
162	-0.18
163	-0.21
164	0.26
165	0.26
166	-0.55
167	-0.60
168	-1.05
169	0.00
171	0.00
172	0.68
173	-0.95
174	0.09
176	0.50
177	-0.49
178	0.34
179	-0.16
180	-0.24
181	-0.50
182	0.45
183	0.29
184	0.41
185	-0.59
186	0.38
187	0.02
188	0.14
189	-0.21
190	0.72
191	0.29
192	0.14
193	0.62
194	-0.34
195	-0.19
196	-0.45
197	-0.01
198	-0.45
199	-0.38
200	-0.56
201	0.49
202	-0.47
203	0.08
204	-0.63
205	0.36
206	0.15
207	-0.67
208	0.53
209	0.42
210	-0.25
211	-0.45
212	-1.38
213	0.40
214	-3.38
215	0.17
216	-1.25
217	-0.14
218	0.44
219	-2.82
220	-1.38
221	-0.68
222	-0.10
223	0.34
224	-0.41
225	-1.03
226	-0.37
227	-0.28
228	0.53
229	-0.75
230	-0.48
231	-0.06
232	0.26
233	0.70
234	0.70
235	0.02
236	0.44
237	-1.25
238	-0.03
240	0.00
241	-1.05
242	-0.29
243	-0.52
244	-2.44
245	-0.64
246	-0.19
247	0.20
248	-0.54
249	-0.96
250	-0.43
#Reported_Model_Average	-0.332
#Overall_Average_Reported	-0.332
Output from Verify3D
Verify3D Score over a window of $winsize_s residues
JPEG image for Verify3D Score
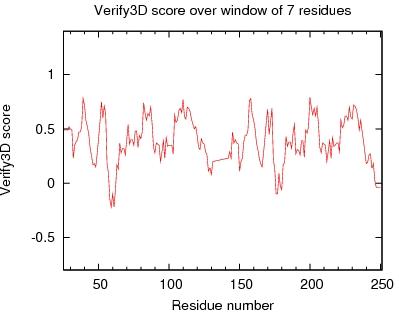
Table of Verify3D scores for ordered residues across all models
#verify3d
#Residue\Model	only_model
25	0.08
26	1.10
27	0.41
28	1.00
29	-0.35
30	0.93
31	0.28
32	0.28
33	0.93
34	0.34
35	-0.80
36	0.51
37	1.10
38	0.47
39	0.71
40	0.93
41	0.71
42	1.06
43	0.08
44	0.09
45	0.08
46	0.17
47	0.04
48	0.25
49	0.51
50	0.10
51	-0.07
52	0.91
53	1.10
54	1.10
55	1.62
56	-0.59
57	0.91
58	-0.54
59	-2.35
60	0.47
61	-0.54
62	1.10
63	0.23
64	0.08
65	0.59
66	-0.74
67	0.17
68	1.14
69	0.47
70	0.52
71	0.08
72	0.17
73	0.24
74	1.14
75	-0.09
76	0.77
77	0.47
78	-0.25
79	1.10
80	0.25
81	0.08
82	0.66
83	0.55
84	0.93
85	1.62
86	0.49
87	-0.25
88	0.51
89	0.49
90	1.10
91	-0.09
92	0.08
93	0.14
94	0.34
95	0.44
96	0.44
97	0.08
98	0.51
99	0.77
100	-0.94
101	1.62
102	-0.10
103	0.51
104	0.10
105	0.51
106	0.17
107	1.62
108	1.10
109	0.08
110	1.10
111	0.28
112	0.23
113	1.00
114	0.47
115	1.00
116	0.81
117	1.06
118	0.08
119	-0.26
120	0.59
121	0.25
122	1.10
123	0.28
124	0.28
125	-0.09
126	0.49
127	0.25
128	0.24
129	0.59
130	0.08
131	-0.80
142	0.14
143	0.08
144	1.10
145	0.41
146	1.00
147	-0.35
148	0.93
149	-0.59
150	0.28
151	0.93
152	0.34
153	-0.80
154	0.34
155	1.10
156	0.47
157	0.71
158	0.93
159	0.71
160	1.06
161	0.47
162	0.09
163	0.08
164	0.17
165	0.04
166	0.25
167	0.51
168	0.10
169	-0.07
170	0.91
171	1.10
172	1.10
173	1.12
174	-1.13
175	0.91
176	0.81
177	-2.35
178	0.47
179	-0.54
180	1.10
181	0.23
182	0.08
183	0.59
184	-0.74
185	0.59
186	1.14
187	0.47
188	0.52
189	0.08
190	0.17
191	0.24
192	1.14
193	-0.74
194	0.77
195	0.47
196	-0.25
197	1.10
198	0.25
199	0.08
200	1.00
201	0.55
202	0.93
203	1.62
204	0.49
205	-0.25
206	0.51
207	0.49
208	1.10
209	-0.09
210	0.08
211	0.14
212	0.34
213	0.44
214	0.44
215	0.08
216	0.51
217	0.77
218	-0.94
219	1.62
220	-0.10
221	0.51
222	0.25
223	0.51
224	0.17
225	1.12
226	1.10
227	0.08
228	1.10
229	0.28
230	0.23
231	1.00
232	0.47
233	1.00
234	0.93
235	1.06
236	0.08
237	-0.26
238	0.17
240	1.10
241	0.28
242	0.28
243	-0.40
244	0.14
245	0.25
246	0.24
247	0.17
248	0.55
249	-0.80
250	-0.84
#Reported_Model_Average	0.389
#Overall_Average_Reported	0.389
Output from ProsaII
ProsaII Score over a window of $winsize_s residues
JPEG image for ProsaII Score
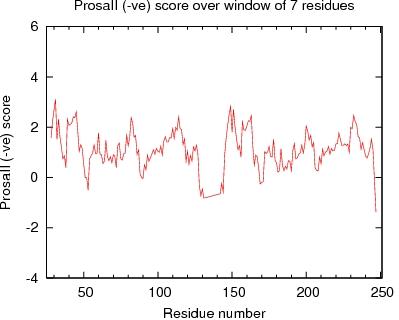
Table of Verify3D scores for ordered residues across all models
#verify3d
#Residue\Model	only_model
25	0.08
26	1.10
27	0.41
28	1.00
29	-0.35
30	0.93
31	0.28
32	0.28
33	0.93
34	0.34
35	-0.80
36	0.51
37	1.10
38	0.47
39	0.71
40	0.93
41	0.71
42	1.06
43	0.08
44	0.09
45	0.08
46	0.17
47	0.04
48	0.25
49	0.51
50	0.10
51	-0.07
52	0.91
53	1.10
54	1.10
55	1.62
56	-0.59
57	0.91
58	-0.54
59	-2.35
60	0.47
61	-0.54
62	1.10
63	0.23
64	0.08
65	0.59
66	-0.74
67	0.17
68	1.14
69	0.47
70	0.52
71	0.08
72	0.17
73	0.24
74	1.14
75	-0.09
76	0.77
77	0.47
78	-0.25
79	1.10
80	0.25
81	0.08
82	0.66
83	0.55
84	0.93
85	1.62
86	0.49
87	-0.25
88	0.51
89	0.49
90	1.10
91	-0.09
92	0.08
93	0.14
94	0.34
95	0.44
96	0.44
97	0.08
98	0.51
99	0.77
100	-0.94
101	1.62
102	-0.10
103	0.51
104	0.10
105	0.51
106	0.17
107	1.62
108	1.10
109	0.08
110	1.10
111	0.28
112	0.23
113	1.00
114	0.47
115	1.00
116	0.81
117	1.06
118	0.08
119	-0.26
120	0.59
121	0.25
122	1.10
123	0.28
124	0.28
125	-0.09
126	0.49
127	0.25
128	0.24
129	0.59
130	0.08
131	-0.80
142	0.14
143	0.08
144	1.10
145	0.41
146	1.00
147	-0.35
148	0.93
149	-0.59
150	0.28
151	0.93
152	0.34
153	-0.80
154	0.34
155	1.10
156	0.47
157	0.71
158	0.93
159	0.71
160	1.06
161	0.47
162	0.09
163	0.08
164	0.17
165	0.04
166	0.25
167	0.51
168	0.10
169	-0.07
170	0.91
171	1.10
172	1.10
173	1.12
174	-1.13
175	0.91
176	0.81
177	-2.35
178	0.47
179	-0.54
180	1.10
181	0.23
182	0.08
183	0.59
184	-0.74
185	0.59
186	1.14
187	0.47
188	0.52
189	0.08
190	0.17
191	0.24
192	1.14
193	-0.74
194	0.77
195	0.47
196	-0.25
197	1.10
198	0.25
199	0.08
200	1.00
201	0.55
202	0.93
203	1.62
204	0.49
205	-0.25
206	0.51
207	0.49
208	1.10
209	-0.09
210	0.08
211	0.14
212	0.34
213	0.44
214	0.44
215	0.08
216	0.51
217	0.77
218	-0.94
219	1.62
220	-0.10
221	0.51
222	0.25
223	0.51
224	0.17
225	1.12
226	1.10
227	0.08
228	1.10
229	0.28
230	0.23
231	1.00
232	0.47
233	1.00
234	0.93
235	1.06
236	0.08
237	-0.26
238	0.17
240	1.10
241	0.28
242	0.28
243	-0.40
244	0.14
245	0.25
246	0.24
247	0.17
248	0.55
249	-0.80
250	-0.84
#Reported_Model_Average	0.389
#Overall_Average_Reported	0.389
Output from MolProbity
VdW violations from MAGE
JPEG image for MAGE VdW violation
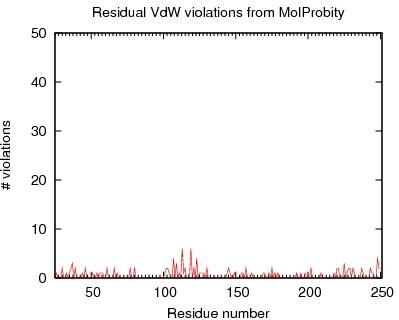
Table of MAGE VdW violations for ordered residues across all models
#mage_clash
#Residue\Model	only_model
25.000	0
26.000	1
27.000	0
28.000	0
29.000	0
30.000	2
31.000	0
32.000	0
33.000	1
34.000	0
35.000	1
36.000	2
37.000	3
38.000	0
39.000	2
40.000	0
41.000	0
42.000	0
43.000	0
44.000	1
45.000	0
46.000	2
47.000	0
48.000	0
49.000	0
50.000	0
51.000	1
52.000	0
53.000	0
54.000	1
55.000	0
56.000	1
57.000	1
58.000	1
59.000	0
60.000	0
61.000	2
62.000	0
63.000	0
64.000	0
65.000	0
66.000	2
67.000	0
68.000	1
69.000	0
70.000	0
71.000	0
72.000	0
73.000	0
74.000	0
75.000	0
76.000	0
77.000	2
78.000	0
79.000	0
80.000	2
81.000	0
82.000	0
83.000	0
84.000	0
85.000	0
86.000	0
87.000	0
88.000	0
89.000	0
90.000	0
91.000	0
92.000	0
93.000	0
94.000	0
95.000	0
96.000	0
97.000	0
98.000	0
99.000	0
100.000	0
101.000	1
102.000	2
103.000	2
104.000	1
105.000	0
106.000	0
107.000	4
108.000	0
109.000	3
110.000	0
111.000	1
112.000	0
113.000	6
114.000	1
115.000	2
116.000	0
117.000	0
118.000	0
119.000	6
120.000	0
121.000	2
122.000	0
123.000	4
124.000	0
125.000	1
126.000	1
127.000	1
128.000	1
129.000	0
130.000	2
131.000	0
132.000	0
133.000	0
134.000	0
135.000	0
136.000	0
137.000	0
138.000	0
139.000	0
140.000	0
141.000	0
142.000	0
143.000	0
144.000	1
145.000	2
146.000	1
147.000	0
148.000	0
149.000	1
150.000	0
151.000	0
152.000	0
153.000	0
154.000	1
155.000	1
156.000	0
157.000	2
158.000	0
159.000	0
160.000	0
161.000	1
162.000	0
163.000	0
164.000	0
165.000	0
166.000	0
167.000	0
168.000	0
169.000	1
170.000	1
171.000	0
172.000	0
173.000	1
174.000	0
175.000	2
176.000	0
177.000	1
178.000	0
179.000	1
180.000	0
181.000	0
182.000	0
183.000	0
184.000	0
185.000	0
186.000	0
187.000	0
188.000	0
189.000	0
190.000	0
191.000	0
192.000	1
193.000	0
194.000	0
195.000	1
196.000	0
197.000	0
198.000	1
199.000	0
200.000	0
201.000	0
202.000	2
203.000	0
204.000	0
205.000	0
206.000	0
207.000	0
208.000	0
209.000	1
210.000	0
211.000	0
212.000	0
213.000	0
214.000	0
215.000	0
216.000	0
217.000	0
218.000	1
219.000	0
220.000	2
221.000	2
222.000	0
223.000	0
224.000	0
225.000	3
226.000	0
227.000	1
228.000	2
229.000	2
230.000	0
231.000	2
232.000	1
233.000	0
234.000	0
235.000	0
236.000	0
237.000	2
238.000	1
239.000	0
240.000	0
241.000	0
242.000	0
243.000	2
244.000	1
245.000	1
246.000	0
247.000	0
248.000	4
249.000	2
250.000	2
#Reported_Model_Average	0.549
#Overall_Average_Reported	0.549
List of bad contacts calculated by MAGE
/farm/software/bin/probe

:  3304:M 123 GLU 2HG  :M 119 ASN 1HD2 :   -0.747:       77
:  3304:M 123 GLU 2HG  :M 119 ASN  ND2 :   -0.728:       77
:  3304:M 119 ASN  OD1 :M 121 GLN 1HB  :   -0.705:       99
:  3304:M 119 ASN 1HD2 :M 123 GLU  CG  :   -0.482:       77
:  3304:M 123 GLU 2HG  :M 119 ASN  CG  :   -0.481:       77
:  3304:M 119 ASN  C   :M 121 GLN  H   :   -0.432:       93

:  3304:M 154 ASP  HA  :M 227 THR 2HG2 :   -0.680:       55

:  3304:M 113 VAL  H   :M 130 THR  CG2 :   -0.678:       75
:  3304:M 130 THR 2HG2 :M 113 VAL  O   :   -0.592:       66
:  3304:M 111 GLU  O   :M 113 VAL 3HG2 :   -0.550:       78
:  3304:M  37 GLY 1HA  :M 107 TRP  CZ2 :   -0.525:       54
:  3304:M 107 TRP  CE2 :M  37 GLY 1HA  :   -0.512:       56
:  3304:M 113 VAL 2HG2 :M  61 ILE 1HG1 :   -0.496:       71
:  3304:M 113 VAL 1HG2 :M 107 TRP  NE1 :   -0.471:       71
:  3304:M 107 TRP  CE2 :M  37 GLY  CA  :   -0.435:       56
:  3304:M 113 VAL 2HG2 :M  61 ILE  CD1 :   -0.434:       71

:  3304:M 249 VAL 3HG2 :M 249 VAL  O   :   -0.660:      103

:  3304:M 221 ASN  ND2 :M 220 LYS 2HG  :   -0.659:       65
:  3304:M 220 LYS 2HG  :M 221 ASN  CG  :   -0.503:       65

:  3304:M 198 GLN 2HG  :M 195 LYS 1HB  :   -0.655:       49

:  3304:M 103 ASN  ND2 :M 102 LYS 2HG  :   -0.642:       84
:  3304:M 103 ASN 1HB  :M 102 LYS  O   :   -0.448:       81

:  3304:M  77 LYS 1HB  :M  80 GLN 2HG  :   -0.625:       35
:  3304:M  77 LYS 1HB  :M  80 GLN  CG  :   -0.462:       35

:  3304:M 127 GLN  OE1 :M 114 LYS 2HE  :   -0.605:       52

:  3304:M  35 VAL  O   :M 109 THR 2HG2 :   -0.596:       98
:  3304:M  36 ASP  HA  :M 109 THR  CG2 :   -0.582:       98
:  3304:M  36 ASP  HA  :M 109 THR 2HG2 :   -0.560:       98

:  3304:M 128 ARG 2HD  :M  33 ILE 2HG1 :   -0.587:       58

:  3304:M 245 GLN  NE2 :M 232 LYS 2HE  :   -0.586:       64

:  3304:M 250 PHE  CD2 :M 228 GLY 1HA  :   -0.564:      117
:  3304:M 228 GLY 1HA  :M 250 PHE  CE2 :   -0.444:      118

:  3304:M 149 GLU 2HG  :M 161 LYS 1HB  :   -0.545:       52

:  3304:M  46 SER 1HB  :M  44 ASN  OD1 :   -0.500:       31
:  3304:M  26 GLY 2HA  :M  46 SER  HA  :   -0.417:       62

:  3304:M 175 MET  CE  :M 202 ILE 2HG1 :   -0.493:       47
:  3304:M 202 ILE 2HG1 :M 175 MET 2HE  :   -0.435:       47

:  3304:M 248 THR 1HG2 :M 229 GLU  O   :   -0.490:       70
:  3304:M 248 THR  O   :M 248 THR 2HG2 :   -0.457:       68
:  3304:M 248 THR  CG2 :M 229 GLU  O   :   -0.456:       70

:  3304:M 192 TYR  HD2 :M 170 MET 1HB  :   -0.483:       38

:  3304:M 237 ASN  HA  :M 173 TRP  CD2 :   -0.472:       50
:  3304:M 244 ALA 2HB  :M 243 VAL  O   :   -0.468:      113
:  3304:M 237 ASN 2HB  :M 243 VAL  CG1 :   -0.405:      110

:  3304:M 101 TRP  HZ2 :M  66 VAL 2HG1 :   -0.469:       46
:  3304:M  66 VAL 1HG1 :M 104 GLN  CD  :   -0.414:       46

:  3304:M  57 MET 2HB  :M  68 TYR 2HB  :   -0.456:       45

:  3304:M 231 VAL 2HG2 :M 179 ILE 1HG1 :   -0.454:       42
:  3304:M 231 VAL 1HG2 :M 225 TRP  CE2 :   -0.445:       42
:  3304:M 155 GLY 1HA  :M 225 TRP  CE2 :   -0.427:       34
:  3304:M 225 TRP  CE3 :M 177 ARG 1HD  :   -0.423:       34

:  3304:M  51 PRO 2HB  :M 169 PRO 2HB  :   -0.449:       22

:  3304:M 115 VAL 2HG1 :M  30 ILE 3HD1 :   -0.442:       35
:  3304:M 115 VAL  CG1 :M  30 ILE 3HD1 :   -0.432:       35

:  3304:M  54 GLY  CA  :M 238 SER 1HB  :   -0.440:       49

:  3304:M 144 GLY  O   :M 145 ASN 1HB  :   -0.439:       53
:  3304:M 145 ASN  OD1 :M 146 VAL  N   :   -0.417:       57

:  3304:M 218 ILE 1HD1 :M 209 VAL  O   :   -0.434:       48

:  3304:M 125 VAL  O   :M 126 ALA 2HB  :   -0.422:      102

:  3304:M  58 ILE 1HD1 :M  56 GLU  OE1 :   -0.417:       54

:  3304:M  39 PHE  CD1 :M  39 PHE  C   :   -0.416:       36

:  3304:M 157 PHE  CD1 :M 157 PHE  C   :   -0.412:       30
#sum2 ::18.77 clashscore : 6.52 clashscore B<40
#summary::3304 atoms:1686 atoms B<40:370342 potential dots:23150.0 A^2:62 bumps:11 bumps B<40:805.6 score
Output from PDB validation software
Summary from PDB validation
                                                       May. 10, 11:01:52 2013

Greetings,

[ Text modified to reflect that this was run under PSVS - Aneerban Bhattacharya: Dec 2005 ]

The following checks were made on :
-----------------------------------------

DISTANCES AND ANGLES

We have checked your intra and intermolecular distances and angles with the
procedures currently in place at PDB:

==> The following solvent molecules are further away than 3.5 Angstroms from
    macromolecule atoms which are available for hydrogen bonding in the
    asymmetric unit.

     none


    The coordinates for water molecules which could be translated back into
    the asymmetric unit are listed.  If you do not indicate otherwise we will
    replace the solvent coordinates in the entry with the ones below:

     none


==> Close contacts in same asymmetric unit.  Distances smaller than 2.2
    Angstroms are considered as close contacts.

      none


==> Close contacts based on crystal symmetry.  Distances smaller than 2.2
    Angstroms are considered as close contacts.

      none


==> Bond and angle checks are performed by first computing the average rms
    error for all bonds and angles relative to standard values for nucleotide
    units [L. Clowney et al., Geometric Parameters in Nucleic Acids: Nitrogenous
    Bases, J.Am.Chem.Soc. 1996, 118, 509-518; A. Gelbin et al., Geometric
    Parameters in Nucleic Acids: Sugar and Phosphate Constituents, J.Am.Chem.Soc.
    1996, 118, 519-529] and amino acid units [R.A. Engh and R. Huber, Accurate
    Bond and Angle Parameters for X-ray protein structure refinement, Acta
    Crystallogr. 1991, A47, 392-400]. Any bond or angle which deviates from the
    dictionary values by more than six times this computed rms error is
    identified as an outlier.


    *** Covalent Bond Lengths:


The RMS deviation for covalent bonds relative to the standard
dictionary is   0.007 Angstroms


The following table contains a list of the covalent bonds
greater than 6.0*RMSD.


 Deviation  Residue  Chain  Sequence  AT1  -  AT2    Bond    Dictionary
             Name     ID     Number                 Distance    Value
------------------------------------------------------------------------
   0.044     PRO        A     96      CG   -  CD     1.547     1.503
   0.046     PRO        B     96      CG   -  CD     1.549     1.503
  -0.049     SER        B    129      CA   -  C      1.476     1.525
  -0.065     THR        B    130      CA   -  CB     1.475     1.540
  -0.045     VAL        B    131      CA   -  CB     1.495     1.540
  -0.047     VAL        B    131      CB   -  CG1    1.474     1.521
  -0.046     VAL        B    131      CB   -  CG2    1.475     1.521

    *** Covalent Angle Values:


The RMS deviation for covalent angles relative to the standard
dictionary is    1.3 degrees.

The following table contains a list of the covalent bond angles
greater than 6.0*RMSD.


 Deviation  Residue  Chain  Sequence  AT1  -  AT2  -  AT3    Bond    Dictionary
             Name     ID     Number                          Angle      Value
--------------------------------------------------------------------------------
   -10.8    ILE       A       30      N    -  CA   -  C      100.4     111.2
    -8.6    ILE       A       33      N    -  CA   -  C      102.6     111.2
     9.4    GLY       A       37      N    -  CA   -  C      121.9     112.5
    -8.2    ILE       A       40      N    -  CA   -  C      103.0     111.2
    -9.9    ILE       B       33      N    -  CA   -  C      101.3     111.2
     9.3    SER       B       72      N    -  CA   -  C      120.5     111.2


TORSION ANGLES

The torsion angle distributions have been checked.  The postscript file of the
conformation rings showing the torsion angle distributions will be sent in a
separate E-mail message.


CHIRALITY

The chirality has been checked and there are no incorrect carbon chiral centers.
Some of O1P and O2P atoms do not follow the convention defined in the standard
IUBMB nomenclature (Liebecq, C. Compendium of Biochemical Nomenclature and Related
Documents, 2nd ed.; Portland Press: London and Chapel Hill, 1992). If you do not
indicate otherwise, we will switch the labels of O1P and O2P as shown below.


OTHER IMPORTANT ISSUES

==> Please check carefully REMARKS 3 and 200 and fill in the parameters as
    appropriate.


   SEQUENCE WARNING: Residue (B SER 120 ) and Residue (B GLY 122 ) are not linked
Distance of C-N bond is 3.56


HR5546A_XRay_em_bcr3.pdb: Error: Z value is 8. It should be 4.