Detailed results of HR4527E_XRay_em_bcr3 by PSVS
Output from PDBStat
Output from PROCHECK
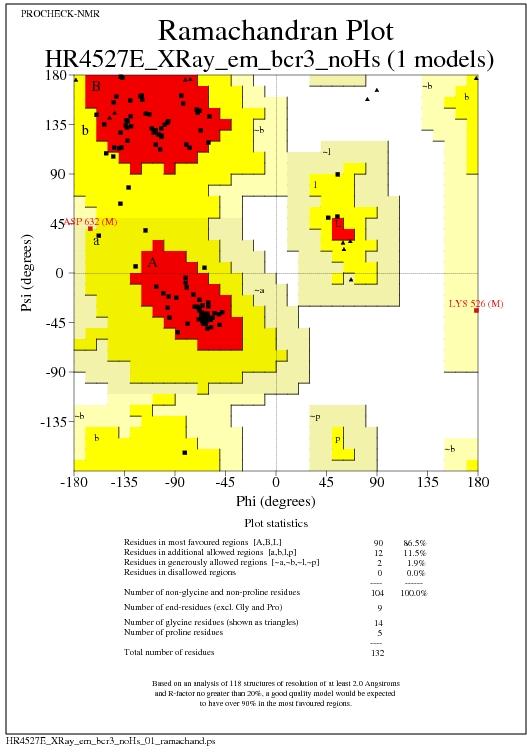
Ramachandran Plot for all models
Text summary of Ramachandran Plot
+----------<<< P R O C H E C K S U M M A R Y >>>----------+
| |
| HR4527E_XRay_em_bcr3_noHs_000.rin 0.0 132 residues |
| |
+| Ramachandran plot: 86.5% core 11.5% allow 1.9% gener 0.0% disall |
| |
*| All Ramachandrans: 4 labelled residues (out of 120) |
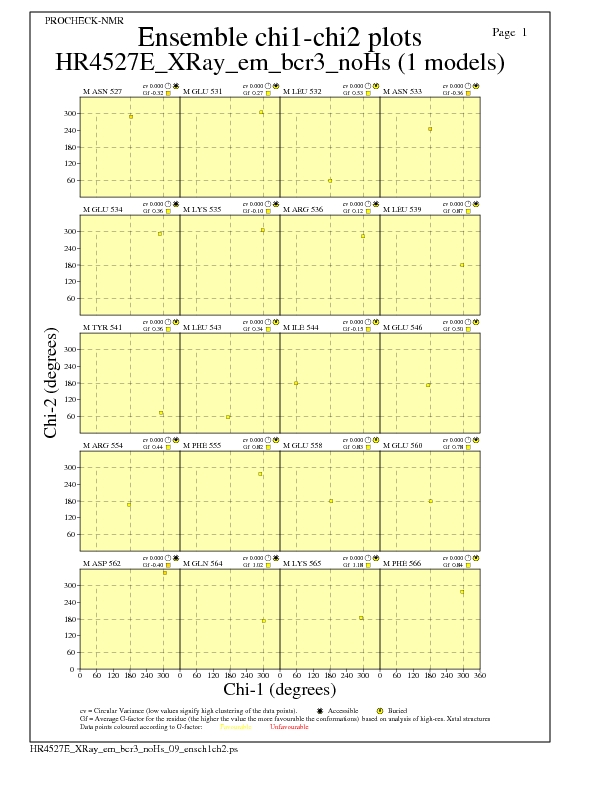
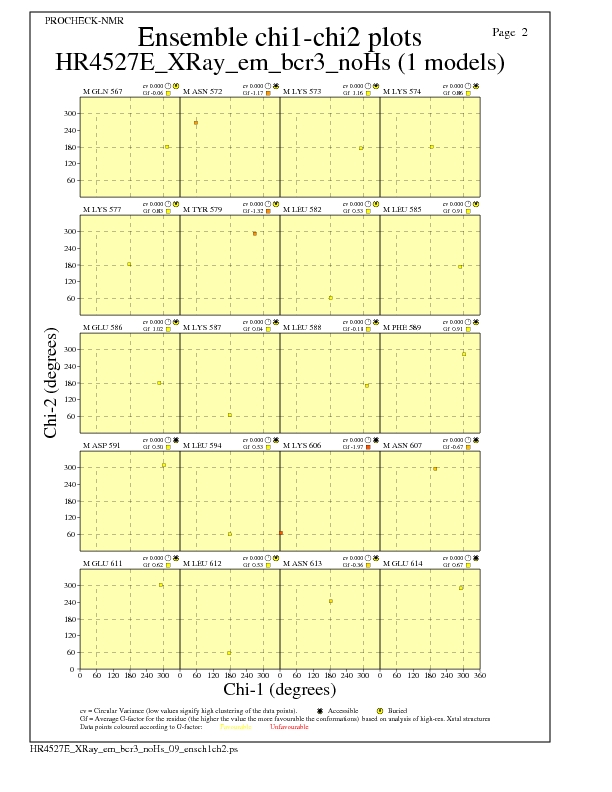
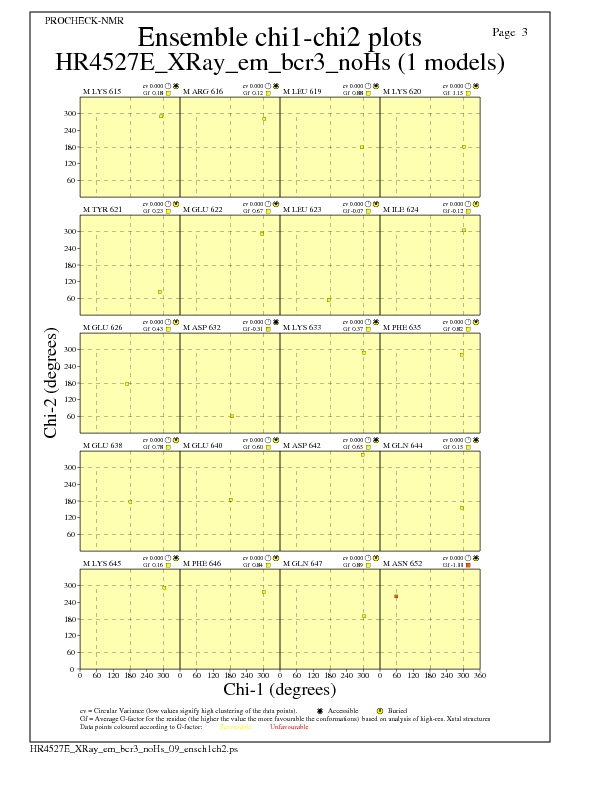
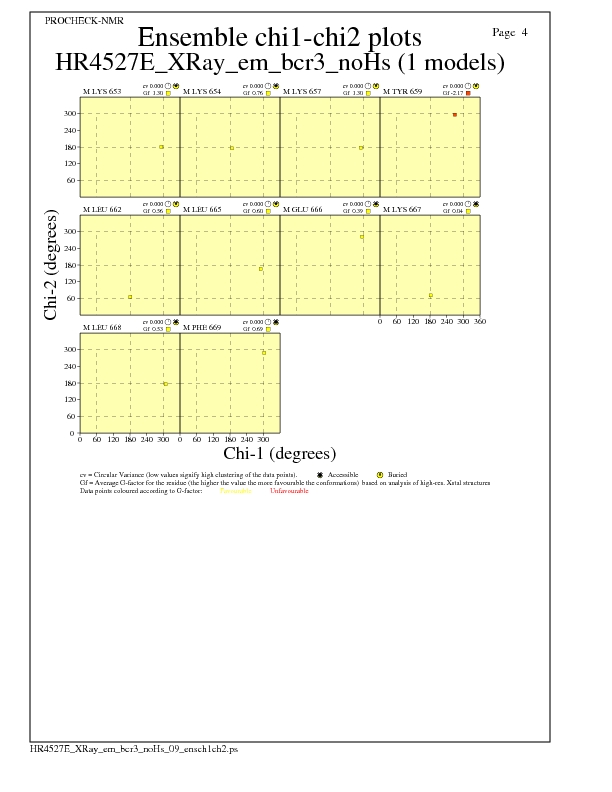
| Chi1-chi2 plots: 0 labelled residues (out of 70) |
JPEG image for all model Ramachandran Plot
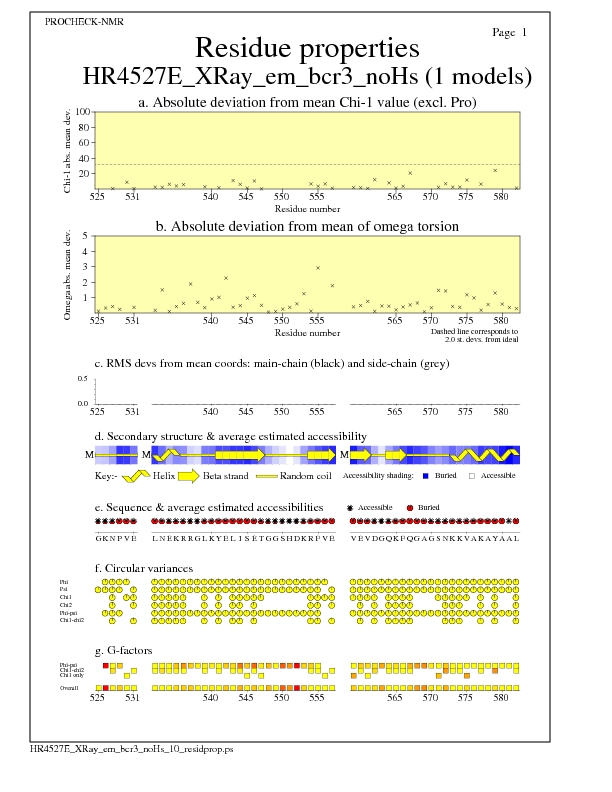
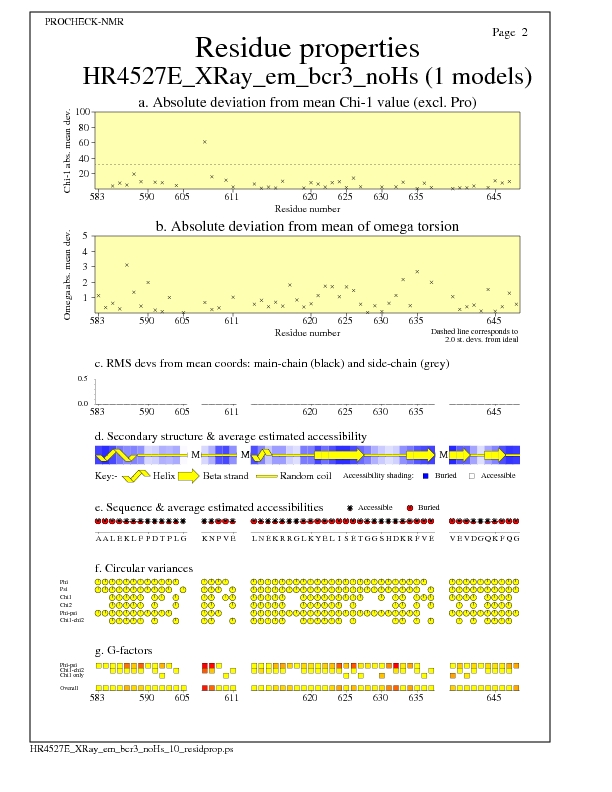
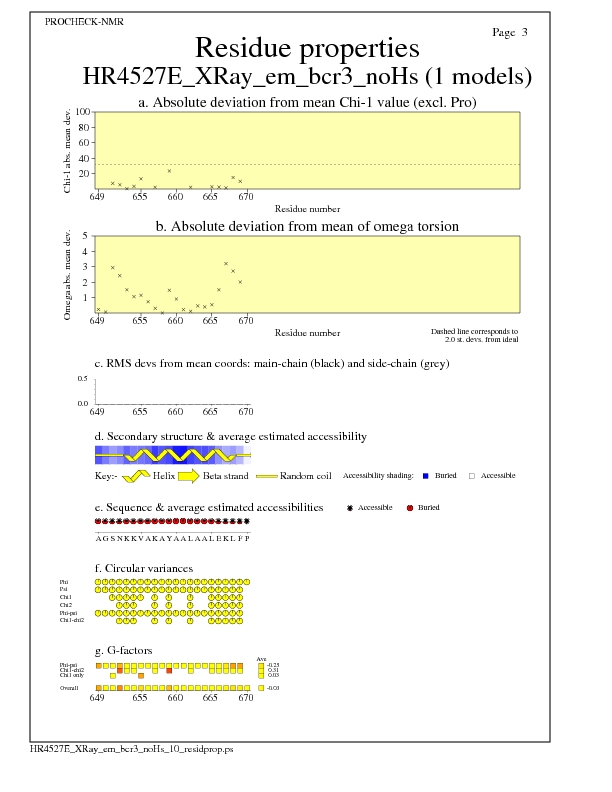
Residue Properties for all models
JPEG for all model Residue Properties - page $num_n
JPEG for all model Residue Properties - page $num_n
JPEG for all model Residue Properties - page $num_n
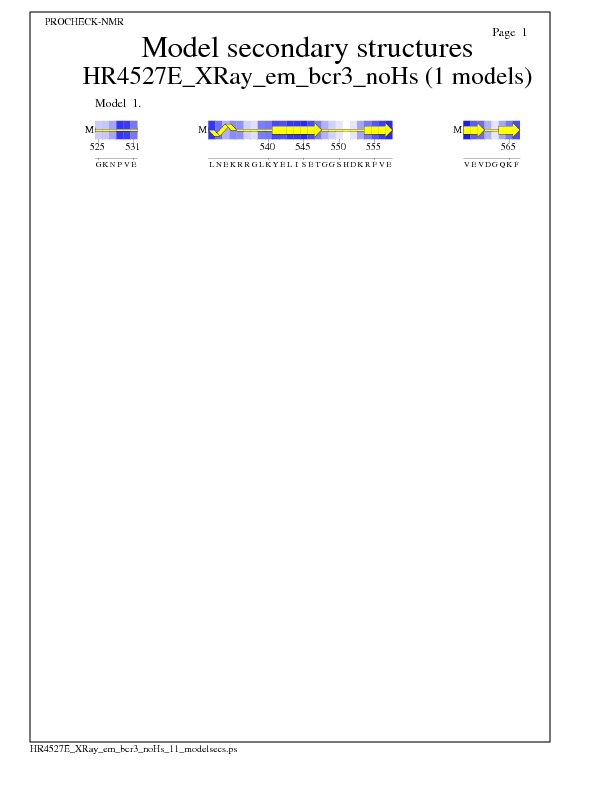
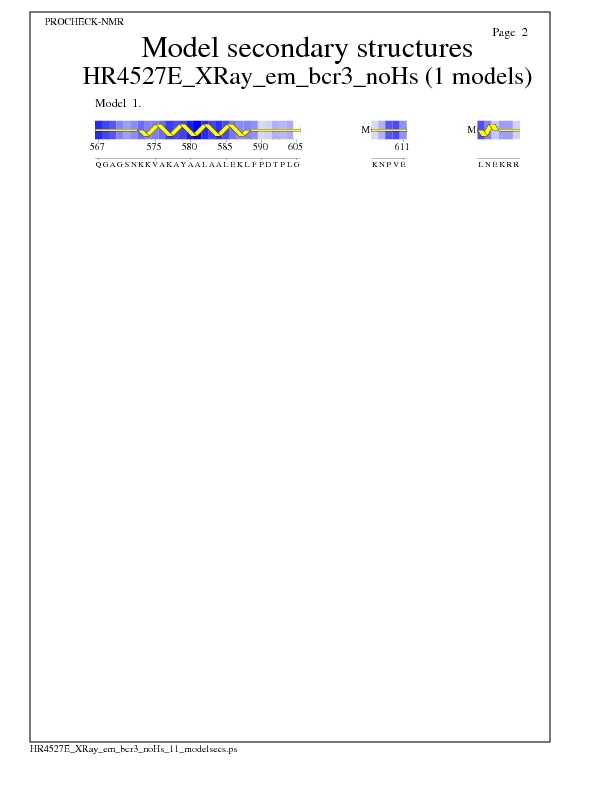
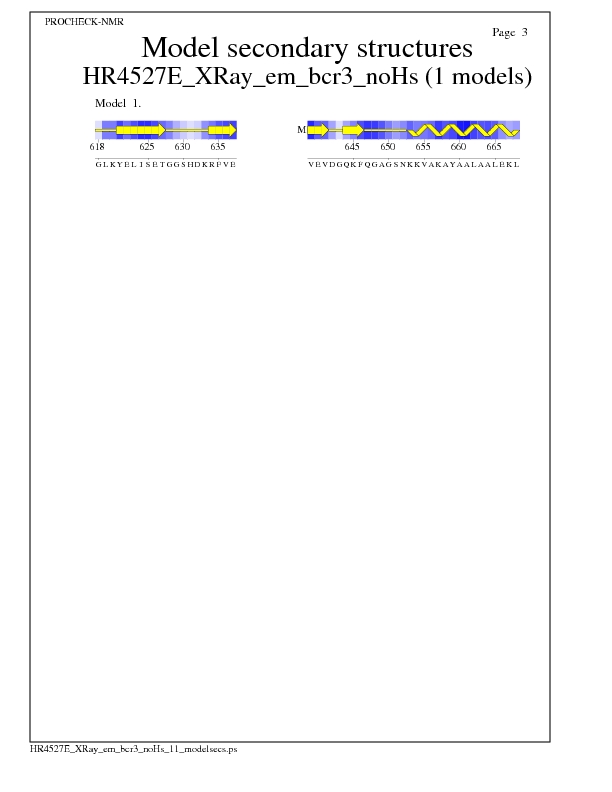
Model Secondary Structures from Procheck
JPEG for Model Secondary Structures - page $num_n
JPEG for Model Secondary Structures - page $num_n
JPEG for Model Secondary Structures - page $num_n
JPEG for Model Secondary Structures - page $num_n
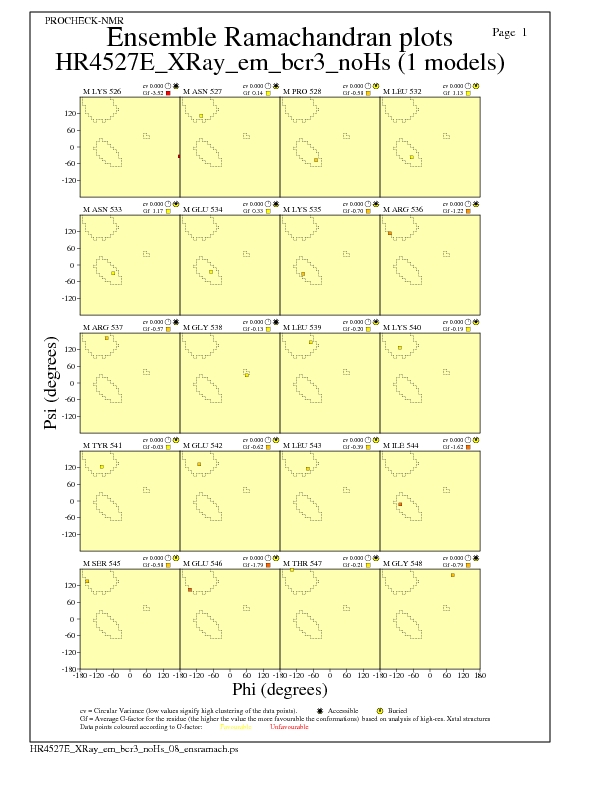
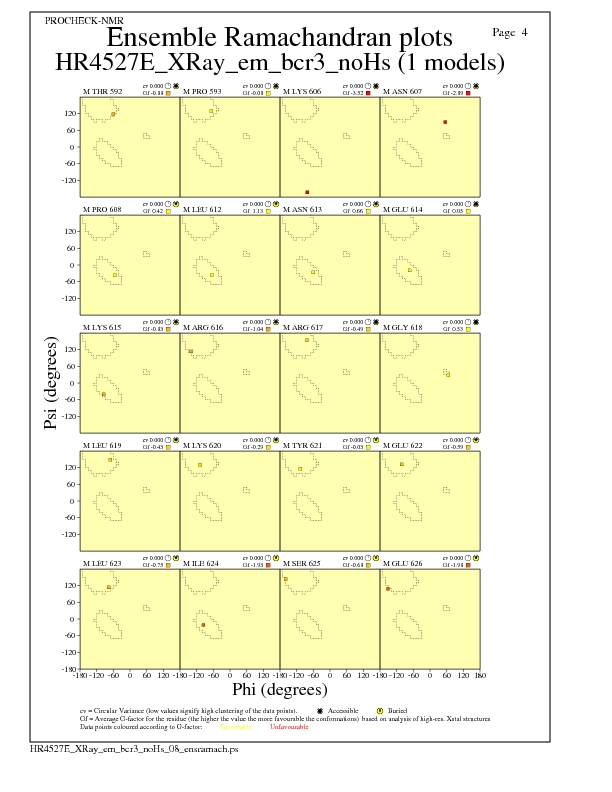
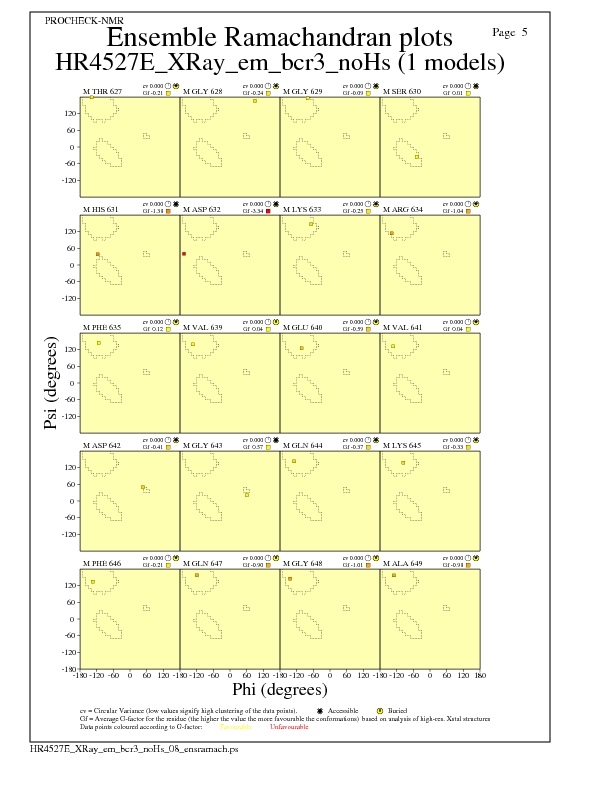
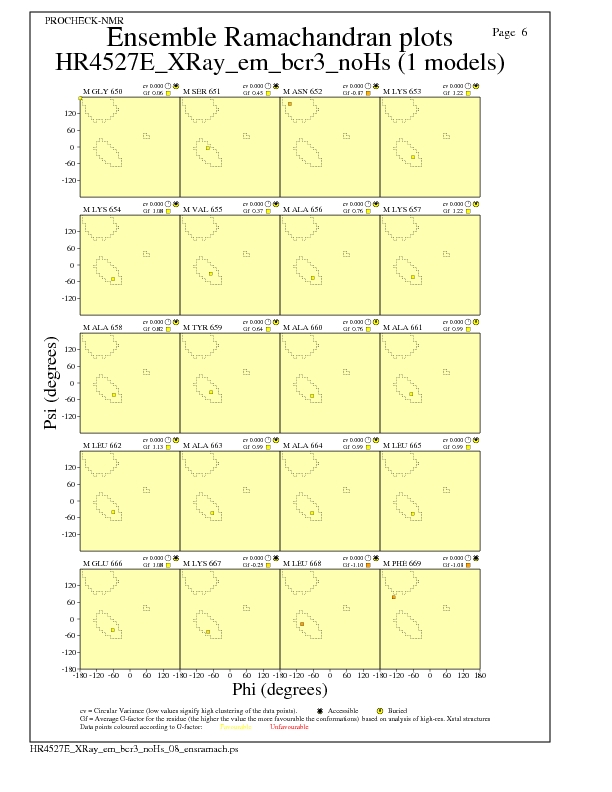
Ramachandran Plots for each residue
JPEG for residue Ramachandran Plots - page $num_n
JPEG for residue Ramachandran Plots - page $num_n

JPEG for residue Ramachandran Plots - page $num_n

JPEG for residue Ramachandran Plots - page $num_n
JPEG for residue Ramachandran Plots - page $num_n
JPEG for residue Ramachandran Plots - page $num_n
Ramachandran analysis for each residue from Molprobity
Chi1-Chi2 Plots for each residue
JPEG for residue Chi1-Chi2 Plots - page $num_n
JPEG for residue Chi1-Chi2 Plots - page $num_n
JPEG for residue Chi1-Chi2 Plots - page $num_n
JPEG for residue Chi1-Chi2 Plots - page $num_n
Procheck G-factors for phi-psi for each residue
JPEG image for residue phi-psi G-factors
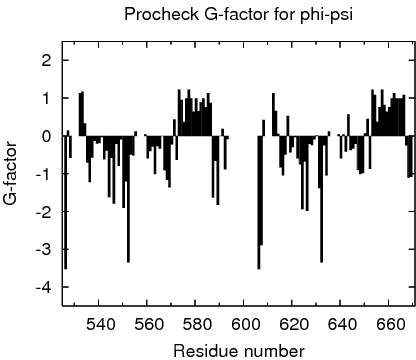
Table of Procheck G-factors for phi-psi for ordered residues
#phipsi_gfactor
#Residue\Model	average
526	-3.52
527	0.14
528	-0.58
532	1.13
533	1.17
534	0.33
535	-0.70
536	-1.22
537	-0.57
538	-0.13
539	-0.20
540	-0.19
541	-0.03
542	-0.62
543	-0.39
544	-1.62
545	-0.58
546	-1.79
547	-0.21
548	-0.79
549	-0.09
550	-1.90
551	-1.20
552	-3.34
553	-0.49
554	-0.51
555	0.12
559	0.04
560	-0.59
561	-0.40
562	-0.28
563	-1.01
564	-0.27
565	-0.33
566	0.00
567	-0.90
568	-1.16
569	-1.36
570	-0.22
571	0.43
572	-0.63
573	1.22
574	0.95
575	0.37
576	0.99
577	1.22
578	0.99
579	0.64
580	0.99
581	0.65
582	0.88
583	0.99
584	0.76
585	1.13
586	0.87
587	-1.63
588	-0.66
589	-1.82
590	0.00
591	0.18
592	-0.88
593	-0.08
606	-3.52
607	-2.89
608	0.42
612	1.13
613	0.66
614	0.05
615	-0.83
616	-1.04
617	-0.49
618	0.53
619	-0.43
620	-0.29
621	-0.03
622	-0.59
623	-0.75
624	-1.93
625	-0.68
626	-1.98
627	-0.21
628	-0.24
629	-0.09
630	0.01
631	-1.38
632	-3.34
633	-0.25
634	-1.04
635	0.12
639	0.04
640	-0.59
641	0.04
642	-0.41
643	0.57
644	-0.37
645	-0.33
646	-0.21
647	-0.90
648	-1.01
649	-0.98
650	0.06
651	0.45
652	-0.87
653	1.22
654	1.08
655	0.37
656	0.76
657	1.22
658	0.82
659	0.64
660	0.76
661	0.99
662	1.13
663	0.99
664	0.99
665	0.99
666	1.08
667	-0.25
668	-1.10
669	-1.08
#Reported_Model_Average	-0.247
#Overall_Average_Reported	-0.247
Procheck G-factors for all dihedral angles for each residue
JPEG image for residue all dihedral G-factors
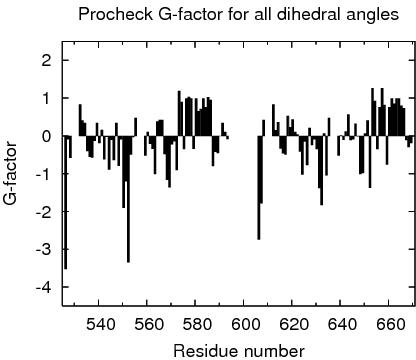
Table of Procheck G-factors for all dihedrals for ordered residues
#alldih_gfactor
#Residue\Model	average
525	0.00
526	-3.52
527	-0.09
528	-0.58
529	0.74
531	0.27
532	0.83
533	0.41
534	0.34
535	-0.40
536	-0.55
537	-0.57
538	-0.13
539	0.34
540	-0.19
541	0.16
542	-0.62
543	-0.02
544	-0.89
545	-0.10
546	-0.64
547	0.34
548	-0.79
549	-0.09
550	-1.90
551	-1.20
552	-3.34
553	-0.49
554	-0.03
555	0.47
556	0.97
558	0.83
559	-0.52
560	0.10
561	-0.21
562	-0.34
563	-1.01
564	0.38
565	0.42
566	0.42
567	-0.48
568	-1.16
569	-1.36
570	-0.22
571	-0.14
572	-0.90
573	1.19
574	0.90
575	-0.35
576	0.99
577	1.03
578	0.99
579	-0.34
580	0.99
581	0.65
582	0.71
583	0.99
584	0.76
585	1.02
586	0.95
587	-0.80
588	-0.42
589	-0.45
590	0.00
591	0.34
592	0.10
593	-0.08
594	0.53
605	0.00
606	-2.74
607	-1.78
608	0.42
609	0.59
611	0.62
612	0.83
613	0.15
614	0.36
615	-0.33
616	-0.46
617	-0.49
618	0.53
619	0.23
620	0.43
621	0.10
622	0.04
623	-0.41
624	-1.02
625	-0.15
626	-0.77
627	0.21
628	-0.24
629	-0.09
630	-0.35
631	-1.38
632	-1.83
633	0.06
634	-1.04
635	0.47
636	0.50
638	0.78
639	-0.52
640	0.01
641	-0.10
642	0.12
643	0.57
644	-0.11
645	-0.09
646	0.32
647	-0.01
648	-1.01
649	-0.98
650	0.06
651	0.41
652	-1.37
653	1.26
654	0.92
655	-0.35
656	0.76
657	1.26
658	0.82
659	-0.76
660	0.76
661	0.99
662	0.85
663	0.99
664	0.99
665	0.80
666	0.73
667	-0.11
668	-0.29
669	-0.19
670	0.00
#Reported_Model_Average	-0.044
#Overall_Average_Reported	-0.044
Output from Verify3D
Verify3D Score over a window of $winsize_s residues
JPEG image for Verify3D Score
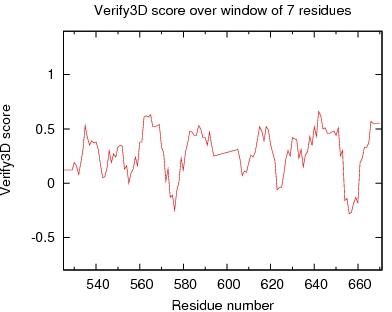
Table of Verify3D scores for ordered residues across all models
#verify3d
#Residue\Model	only_model
525	1.10
526	0.00
527	0.51
528	0.64
529	-0.09
530	-0.83
531	-0.46
532	1.06
533	0.51
534	0.28
535	0.08
536	0.71
537	0.00
538	1.10
539	0.29
540	0.00
541	0.52
542	0.00
543	0.77
544	-0.54
545	0.17
546	-0.59
547	0.08
548	1.10
549	1.10
550	0.00
551	0.00
552	0.00
553	0.00
554	0.24
555	1.04
556	-0.40
557	0.23
558	-1.13
559	0.66
560	0.28
561	1.00
562	0.51
563	1.10
564	0.25
565	0.47
566	0.71
567	0.25
568	1.10
569	-0.25
570	1.10
571	0.34
572	0.51
573	-0.72
574	-0.10
575	-0.74
576	0.49
577	-0.72
578	0.49
579	-0.43
580	0.49
581	0.49
582	0.77
583	-0.25
584	0.49
585	1.06
586	0.28
587	0.47
588	0.29
589	0.71
590	0.44
591	0.23
592	0.55
593	0.25
594	0.00
605	1.10
606	-0.10
607	-0.26
608	0.64
609	-0.09
610	-0.83
611	0.28
612	1.06
613	0.51
614	0.28
615	0.47
616	0.24
617	0.00
618	1.10
619	0.77
620	-0.10
621	1.14
622	0.28
623	-0.68
624	-0.54
625	0.59
626	-1.13
627	0.08
628	1.10
629	1.10
630	0.34
631	0.00
632	0.23
633	0.08
634	0.00
635	1.04
636	-0.09
637	0.91
638	-1.13
639	1.00
640	0.28
641	1.00
642	0.51
643	1.10
644	0.25
645	0.47
646	0.71
647	-0.57
648	1.10
649	0.14
650	1.10
651	0.34
652	0.51
653	0.47
654	-0.10
655	-0.74
656	0.49
657	-2.12
658	0.49
659	-0.43
660	0.49
661	0.49
662	-0.33
663	0.14
664	0.49
665	0.77
666	0.28
667	0.47
668	0.77
669	1.04
670	0.00
#Reported_Model_Average	0.287
#Overall_Average_Reported	0.287
Output from ProsaII
ProsaII Score over a window of $winsize_s residues
JPEG image for ProsaII Score
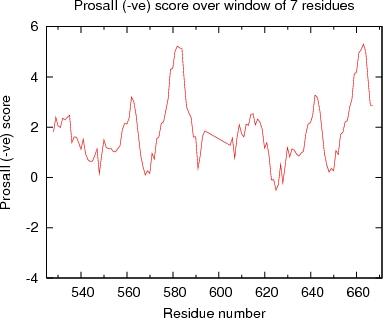
Table of Verify3D scores for ordered residues across all models
#verify3d
#Residue\Model	only_model
525	1.10
526	0.00
527	0.51
528	0.64
529	-0.09
530	-0.83
531	-0.46
532	1.06
533	0.51
534	0.28
535	0.08
536	0.71
537	0.00
538	1.10
539	0.29
540	0.00
541	0.52
542	0.00
543	0.77
544	-0.54
545	0.17
546	-0.59
547	0.08
548	1.10
549	1.10
550	0.00
551	0.00
552	0.00
553	0.00
554	0.24
555	1.04
556	-0.40
557	0.23
558	-1.13
559	0.66
560	0.28
561	1.00
562	0.51
563	1.10
564	0.25
565	0.47
566	0.71
567	0.25
568	1.10
569	-0.25
570	1.10
571	0.34
572	0.51
573	-0.72
574	-0.10
575	-0.74
576	0.49
577	-0.72
578	0.49
579	-0.43
580	0.49
581	0.49
582	0.77
583	-0.25
584	0.49
585	1.06
586	0.28
587	0.47
588	0.29
589	0.71
590	0.44
591	0.23
592	0.55
593	0.25
594	0.00
605	1.10
606	-0.10
607	-0.26
608	0.64
609	-0.09
610	-0.83
611	0.28
612	1.06
613	0.51
614	0.28
615	0.47
616	0.24
617	0.00
618	1.10
619	0.77
620	-0.10
621	1.14
622	0.28
623	-0.68
624	-0.54
625	0.59
626	-1.13
627	0.08
628	1.10
629	1.10
630	0.34
631	0.00
632	0.23
633	0.08
634	0.00
635	1.04
636	-0.09
637	0.91
638	-1.13
639	1.00
640	0.28
641	1.00
642	0.51
643	1.10
644	0.25
645	0.47
646	0.71
647	-0.57
648	1.10
649	0.14
650	1.10
651	0.34
652	0.51
653	0.47
654	-0.10
655	-0.74
656	0.49
657	-2.12
658	0.49
659	-0.43
660	0.49
661	0.49
662	-0.33
663	0.14
664	0.49
665	0.77
666	0.28
667	0.47
668	0.77
669	1.04
670	0.00
#Reported_Model_Average	0.287
#Overall_Average_Reported	0.287
Output from MolProbity
VdW violations from MAGE
JPEG image for MAGE VdW violation
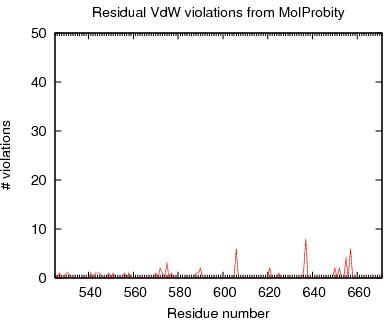
Table of MAGE VdW violations for ordered residues across all models
#mage_clash
#Residue\Model	only_model
525.000	1
526.000	0
527.000	1
528.000	0
529.000	0
530.000	1
531.000	1
532.000	0
533.000	0
534.000	0
535.000	0
536.000	0
537.000	0
538.000	0
539.000	0
540.000	0
541.000	1
542.000	0
543.000	1
544.000	1
545.000	1
546.000	0
547.000	0
548.000	0
549.000	1
550.000	0
551.000	1
552.000	0
553.000	0
554.000	0
555.000	0
556.000	1
557.000	0
558.000	1
559.000	0
560.000	0
561.000	0
562.000	0
563.000	0
564.000	0
565.000	0
566.000	0
567.000	0
568.000	0
569.000	0
570.000	1
571.000	0
572.000	2
573.000	1
574.000	0
575.000	3
576.000	0
577.000	1
578.000	0
579.000	0
580.000	0
581.000	0
582.000	0
583.000	0
584.000	0
585.000	0
586.000	0
587.000	0
588.000	1
589.000	1
590.000	2
591.000	0
592.000	0
593.000	0
594.000	0
595.000	0
596.000	0
597.000	0
598.000	0
599.000	0
600.000	0
601.000	0
602.000	0
603.000	0
604.000	0
605.000	0
606.000	6
607.000	0
608.000	0
609.000	0
610.000	0
611.000	0
612.000	0
613.000	0
614.000	0
615.000	0
616.000	0
617.000	0
618.000	0
619.000	0
620.000	0
621.000	2
622.000	0
623.000	0
624.000	0
625.000	1
626.000	0
627.000	0
628.000	0
629.000	0
630.000	0
631.000	0
632.000	0
633.000	0
634.000	0
635.000	0
636.000	1
637.000	8
638.000	0
639.000	0
640.000	0
641.000	0
642.000	0
643.000	0
644.000	0
645.000	0
646.000	0
647.000	0
648.000	0
649.000	0
650.000	2
651.000	0
652.000	2
653.000	0
654.000	0
655.000	4
656.000	0
657.000	6
658.000	0
659.000	0
660.000	0
661.000	0
662.000	0
663.000	0
664.000	0
665.000	0
666.000	0
667.000	0
668.000	0
669.000	0
670.000	0
#Reported_Model_Average	0.384
#Overall_Average_Reported	0.384
List of bad contacts calculated by MAGE
/farm/software/bin/probe

:  1977:M 621 TYR 2HB  :M 637 MET  CE  :   -0.826:       46
:  1977:M 621 TYR 2HB  :M 637 MET 3HE  :   -0.812:       46
:  1977:M 637 MET  CE  :M 657 LYS 1HG  :   -0.720:       46
:  1977:M 637 MET 3HE  :M 657 LYS 1HG  :   -0.711:       46
:  1977:M 637 MET 2HE  :M 657 LYS 1HD  :   -0.463:       46
:  1977:M 637 MET  CE  :M 657 LYS  CG  :   -0.461:       46
:  1977:M 637 MET 2HG  :M 657 LYS 2HG  :   -0.410:       33
:  1977:M 637 MET 2HG  :M 657 LYS  CG  :   -0.401:       33

:  1977:M 606 LYS  H   :M 606 LYS 1HD  :   -0.807:       55
:  1977:M 606 LYS  CD  :M 606 LYS  H   :   -0.709:       55
:  1977:M 606 LYS 1HD  :M 606 LYS  N   :   -0.579:       55

:  1977:M 655 VAL  H   :M 652 ASN  ND2 :   -0.702:       18
:  1977:M 655 VAL  H   :M 652 ASN 1HD2 :   -0.433:       18
:  1977:M 650 GLY 2HA  :M 655 VAL 3HG1 :   -0.424:       26
:  1977:M 655 VAL  CG1 :M 650 GLY 2HA  :   -0.420:       26

:  1977:M 572 ASN  ND2 :M 575 VAL  H   :   -0.642:       16
:  1977:M 575 VAL 3HG1 :M 570 GLY 2HA  :   -0.451:       20
:  1977:M 575 VAL  H   :M 572 ASN 1HD2 :   -0.418:       16

:  1977:M 577 LYS 2HG  :M 541 TYR  CD2 :   -0.637:       35

:  1977:M 545 SER 1HB  :M 556 VAL  HB  :   -0.623:       25

:  1977:M 525 GLY 1HA  :M 531 GLU  OE2 :   -0.531:       55

:  1977:M 549 GLY  C   :M 551 HIS  H   :   -0.483:       59

:  1977:M 530 MET 2HG  :M 527 ASN 2HB  :   -0.466:       50

:  1977:M 636 VAL  HB  :M 625 SER 1HB  :   -0.459:       23

:  1977:M 544 ILE 3HD1 :M 558 GLU 1HB  :   -0.453:       33

:  1977:M 590 PRO 2HD  :M 589 PHE  N   :   -0.431:       20
:  1977:M 590 PRO 2HD  :M 588 LEU  C   :   -0.401:       20

:  1977:M 543 LEU 2HD2 :M 573 LYS 1HE  :   -0.423:       42
#sum2 ::14.16 clashscore : 9.19 clashscore B<40
#summary::1977 atoms:1632 atoms B<40:224519 potential dots:14030.0 A^2:28 bumps:15 bumps B<40:599.6 score
Output from PDB validation software
Summary from PDB validation
                                                       May. 10, 09:25:44 2013

Greetings,

[ Text modified to reflect that this was run under PSVS - Aneerban Bhattacharya: Dec 2005 ]

The following checks were made on :
-----------------------------------------

DISTANCES AND ANGLES

We have checked your intra and intermolecular distances and angles with the
procedures currently in place at PDB:

==> The following solvent molecules are further away than 3.5 Angstroms from
    macromolecule atoms which are available for hydrogen bonding in the
    asymmetric unit.

     none


    The coordinates for water molecules which could be translated back into
    the asymmetric unit are listed.  If you do not indicate otherwise we will
    replace the solvent coordinates in the entry with the ones below:

     none


==> Close contacts in same asymmetric unit.  Distances smaller than 2.2
    Angstroms are considered as close contacts.

      none


==> Close contacts based on crystal symmetry.  Distances smaller than 2.2
    Angstroms are considered as close contacts.

      none


==> Bond and angle checks are performed by first computing the average rms
    error for all bonds and angles relative to standard values for nucleotide
    units [L. Clowney et al., Geometric Parameters in Nucleic Acids: Nitrogenous
    Bases, J.Am.Chem.Soc. 1996, 118, 509-518; A. Gelbin et al., Geometric
    Parameters in Nucleic Acids: Sugar and Phosphate Constituents, J.Am.Chem.Soc.
    1996, 118, 519-529] and amino acid units [R.A. Engh and R. Huber, Accurate
    Bond and Angle Parameters for X-ray protein structure refinement, Acta
    Crystallogr. 1991, A47, 392-400]. Any bond or angle which deviates from the
    dictionary values by more than six times this computed rms error is
    identified as an outlier.


    *** Covalent Bond Lengths:


The RMS deviation for covalent bonds relative to the standard
dictionary is   0.005 Angstroms


The following table contains a list of the covalent bonds
greater than 6.0*RMSD.


 Deviation  Residue  Chain  Sequence  AT1  -  AT2    Bond    Dictionary
             Name     ID     Number                 Distance    Value
------------------------------------------------------------------------
   0.042     GLY        A    525      N    -  CA     1.493     1.451
   0.041     GLY        B    525      N    -  CA     1.492     1.451

    *** Covalent Angle Values:


The RMS deviation for covalent angles relative to the standard
dictionary is    1.1 degrees.

The following table contains a list of the covalent bond angles
greater than 6.0*RMSD.


 Deviation  Residue  Chain  Sequence  AT1  -  AT2  -  AT3    Bond    Dictionary
             Name     ID     Number                          Angle      Value
--------------------------------------------------------------------------------
     6.7    GLY       A      538      N    -  CA   -  C      119.2     112.5
    -6.6    LEU       A      543      N    -  CA   -  C      104.6     111.2
     6.7    GLY       B      538      N    -  CA   -  C      119.2     112.5
     6.7    LEU       B      588      N    -  CA   -  C      117.9     111.2


TORSION ANGLES

The torsion angle distributions have been checked.  The postscript file of the
conformation rings showing the torsion angle distributions will be sent in a
separate E-mail message.


CHIRALITY

The chirality has been checked and there are no incorrect carbon chiral centers.
Some of O1P and O2P atoms do not follow the convention defined in the standard
IUBMB nomenclature (Liebecq, C. Compendium of Biochemical Nomenclature and Related
Documents, 2nd ed.; Portland Press: London and Chapel Hill, 1992). If you do not
indicate otherwise, we will switch the labels of O1P and O2P as shown below.


OTHER IMPORTANT ISSUES

==> Please check carefully REMARKS 3 and 200 and fill in the parameters as
    appropriate.


==> The following residues have missing atoms:

     RES MOD#C SEQ          ATOMS

     LYS(    A 526)          CG   CD   CE   NZ
     ARG(    A 537)          CG   CD   NE   CZ  NH1  NH2
     LYS(    A 540)          CB   CG   CD   CE   NZ
     GLU(    A 542)          CG   CD  OE1  OE2
     SER(    A 550)          CB   OG
     HIS(    A 551)          CB   CG  ND1  CD2  CE1  NE2
     ASP(    A 552)          CB   CG  OD1  OD2
     LYS(    A 553)          CG   CD   CE   NZ
     ARG(    B 537)          CG   CD   NE   CZ  NH1  NH2
     HIS(    B 551)          CB   CG  ND1  CD2  CE1  NE2
     ARG(    B 554)          CG   CD   NE   CZ  NH1  NH2
     PRO(    B 590)          CG   CD
==> The following residues have extra atoms:

     RES MOD#C SEQ          ATOMS

     LEU(    A 594)          O2


HR4527E_XRay_em_bcr3.pdb: Error: Z value is 8. It should be 4.